 | 24 Mar 2020
Moisture sources and synoptic conditions of summer precipitation in the glacial zone of the East Sayan Range
Olga P. Osipova
Precipitation in high-mountain regions is characterized by a strong heterogeneity due to complex interaction between atmospheric circulation and steep topography, however, extremely rare network of high elevation stations hampers the adequate high resolution regional climate modeling. In this study we present new data of precipitation directly measured in high-mountain catchment, on the continental glacier (East Sayan Range, south of East Siberia) during the summer periods of 2015–2017 using automatic weather station. The precipitation record was compared with near located weather stations and ERA Interim and NCEP/NCAR reanalysis data. Precipitation mode similar to the glacier site was found at the stations located west and northwest, while ERA Interim and NCEP/NCAR reanalysis data underestimated the precipitation by 40 % and 70 %, respectively. Atmospheric circulation patterns in days with precipitation were analyzed by using mean sea level pressure, geopotential height at 700 and 500 hPa and classification of macro scale atmospheric processes of the Northern Hemisphere by Dzerdzeevskii. Summer precipitation was mostly associated with meridional southern group of large scale circulation the Northern Hemisphere, while at synoptic scale it basically fell in cyclonic (49 % of precipitation) and low-gradient cyclonic (30 %) baric fields. Six typical atmospheric circulation patterns over the East Sayan were identified for days with precipitation. The sources and atmospheric moisture transfer to the glacier was defined by using the HYSPLIT trajectory model. The most of summer precipitation (70 %) was related with western cyclones, while about 25 % of rainfalls (mainly of moderate to strong intensity) was originated from the south-east (Pacific monsoon influence).
- Article
(12095 KB) - Full-text XML
- BibTeX
- EndNote


Precipitation, both in solid and liquid form, is an important component of mass balance in high-mountain glaciarized basins. It affects the formation of snow cover, accumulation, ablation, and energy balance (e.g. albedo in case of summer snowfalls) of glaciers. For example, it was found that summer balance of the glaciers of south-east Siberia is largely associated with atmospheric circulation processes of different scales (Osipova and Osipov, 2018). At the same time some persistent processes in the atmosphere significantly affects the precipitation anomalies in Eastern Siberia and Mongolia (Antokhina et al., 2016). However, understanding of fundamental nature of such relationship is limited by the lack of more or less continuous observational data from high-mountain catchments. Obtaining such meteorological time series will contribute to more reliable spatially distributed climate models, which are a useful tool for predicting climate changes and their effects on the environment, including hazardous events (e.g. catastrophic floods).
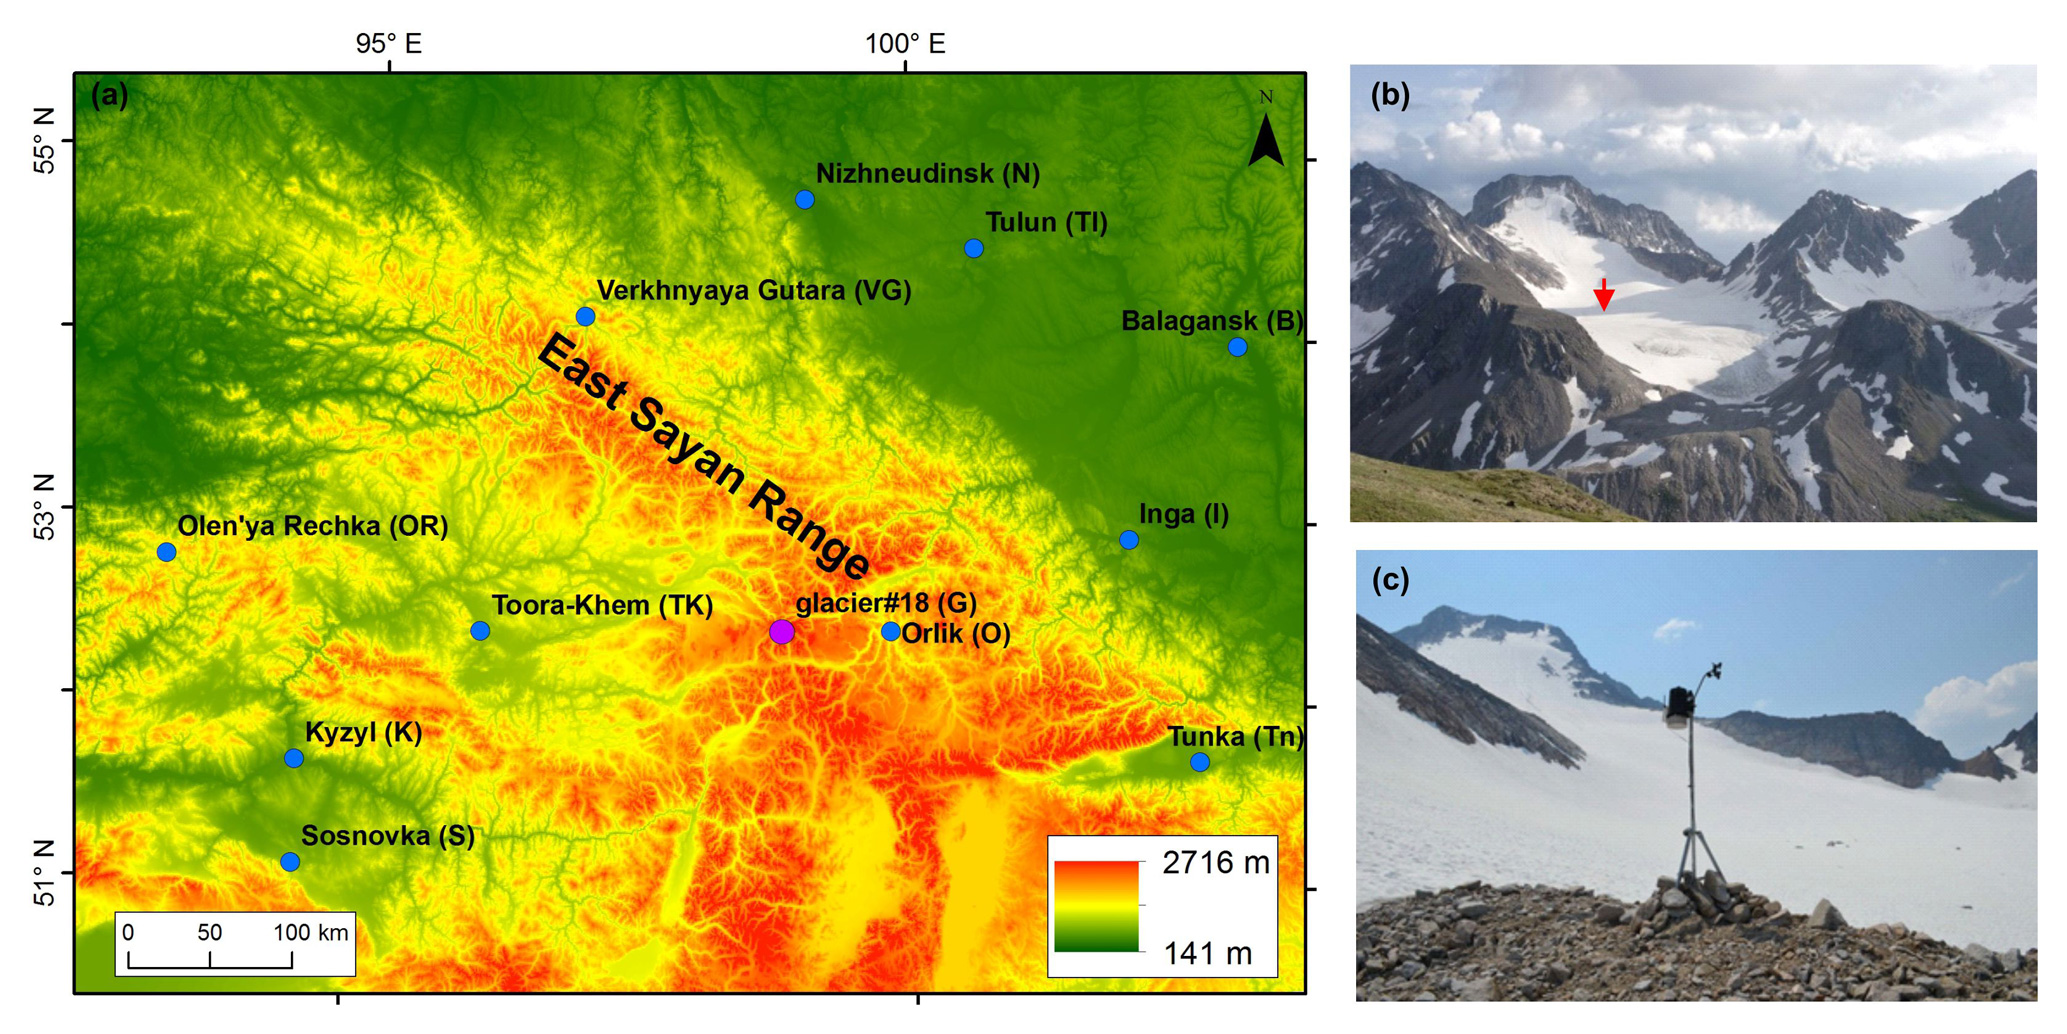
Figure 1Location of the Glacier #18 (purple circle) and 11 regional weather stations (blue circles) in the East Sayan Range area (a). Pictures of the glacier (b) and installed automatic weather station (AWS) (c). Red arrow (b) shows the AWS site location.
The high mountains of the south of Eastern Siberia are distinguished by an extremely rare network of conventional meteorological stations and complete absence of automatic stations. The severe topography and atmospheric circulation determine here the heterogeneity of precipitation, both spatial and seasonal. Recently, spatiotemporal inhomogeneity of precipitation of warm period has been found in the northern part of the Baikal mountain region and moisture sources identified (Osipova and Osipov, 2019a). In 2015–2017, for the first time, we obtained meteorological series of observations from the East Sayan mountains using automatic station and evaluated the main components of the surface energy balance of the glacier during summer periods (Osipova and Osipov, 2019b). In this study, we focused on the analysis of the precipitation record from the East Sayan glacier basin and its correlation with regional weather stations, reanalysis data and multiscale atmospheric circulation processes which determine the transportation and precipitation of moisture on the glacier.
The study Glacier #18 is located in central part of the East Sayan Range (Fig. 1a and b). East Sayan, East Siberia, of length about 1000 km is located inside the Asian continent, far from the oceans. There are some high-mountain massifs with summits more than 3000 m, such as Peak Topografov (3015 m a.s.l.) and Munku-Sardyk (3491 m a.s.l.), located in central and south-eastern parts of the range, respectively. East Sayan is one of the centers of mountain glaciation in southern Siberia. There are about 270 small glaciers with total area of about 20 km2 (Osipov et al., 2017). Due to recent climate change, the glaciers are intensively shrinking since the end of the Little Ice Age (Osipov and Osipova, 2014, 2018). Their total area declined by about 60 %. The Glacier No. 18 is located on the north-eastern slope of the Peak Topografov massif. This is the second largest (0.93 km2) and the longest (2.01 km) glacier in the East Sayan. Altitude range of the glacier is 630 m (from 2320 to 2950 m), main aspect is north-eastern, the average slope of the glacier surface is 17∘, the firn line elevation is 2500 m a.s.l. The climate of the study area is sharply continental with cold winters and warm summers. Summer precipitation (June–August) ranges from 35 % to 73 % (data of 11 meteorological stations) of their annual amount.
The automatic weather station was installed in the lower part of accumulation area of the glacier (52.5∘ N, 98.8∘ E) during 3 summer periods, from 2015 to 2017 (Fig. 1a and b). We used a low-cost automatic weather station Davis (Davis Instruments Corporation, USA), measuring such parameters as air temperature, relative humidity, wind speed and direction, atmospheric pressure, incoming shortwave radiation, and precipitation (Fig. 1c). The sensors were about 2 m above the ground. The raw data were archived every 1 h. The observation period varied from 11 d (in 2015) to 62 d (in 2017). In this paper we only focused on precipitation data. Total length of the obtained precipitation record (combined over 3 summer periods) was 131 d.
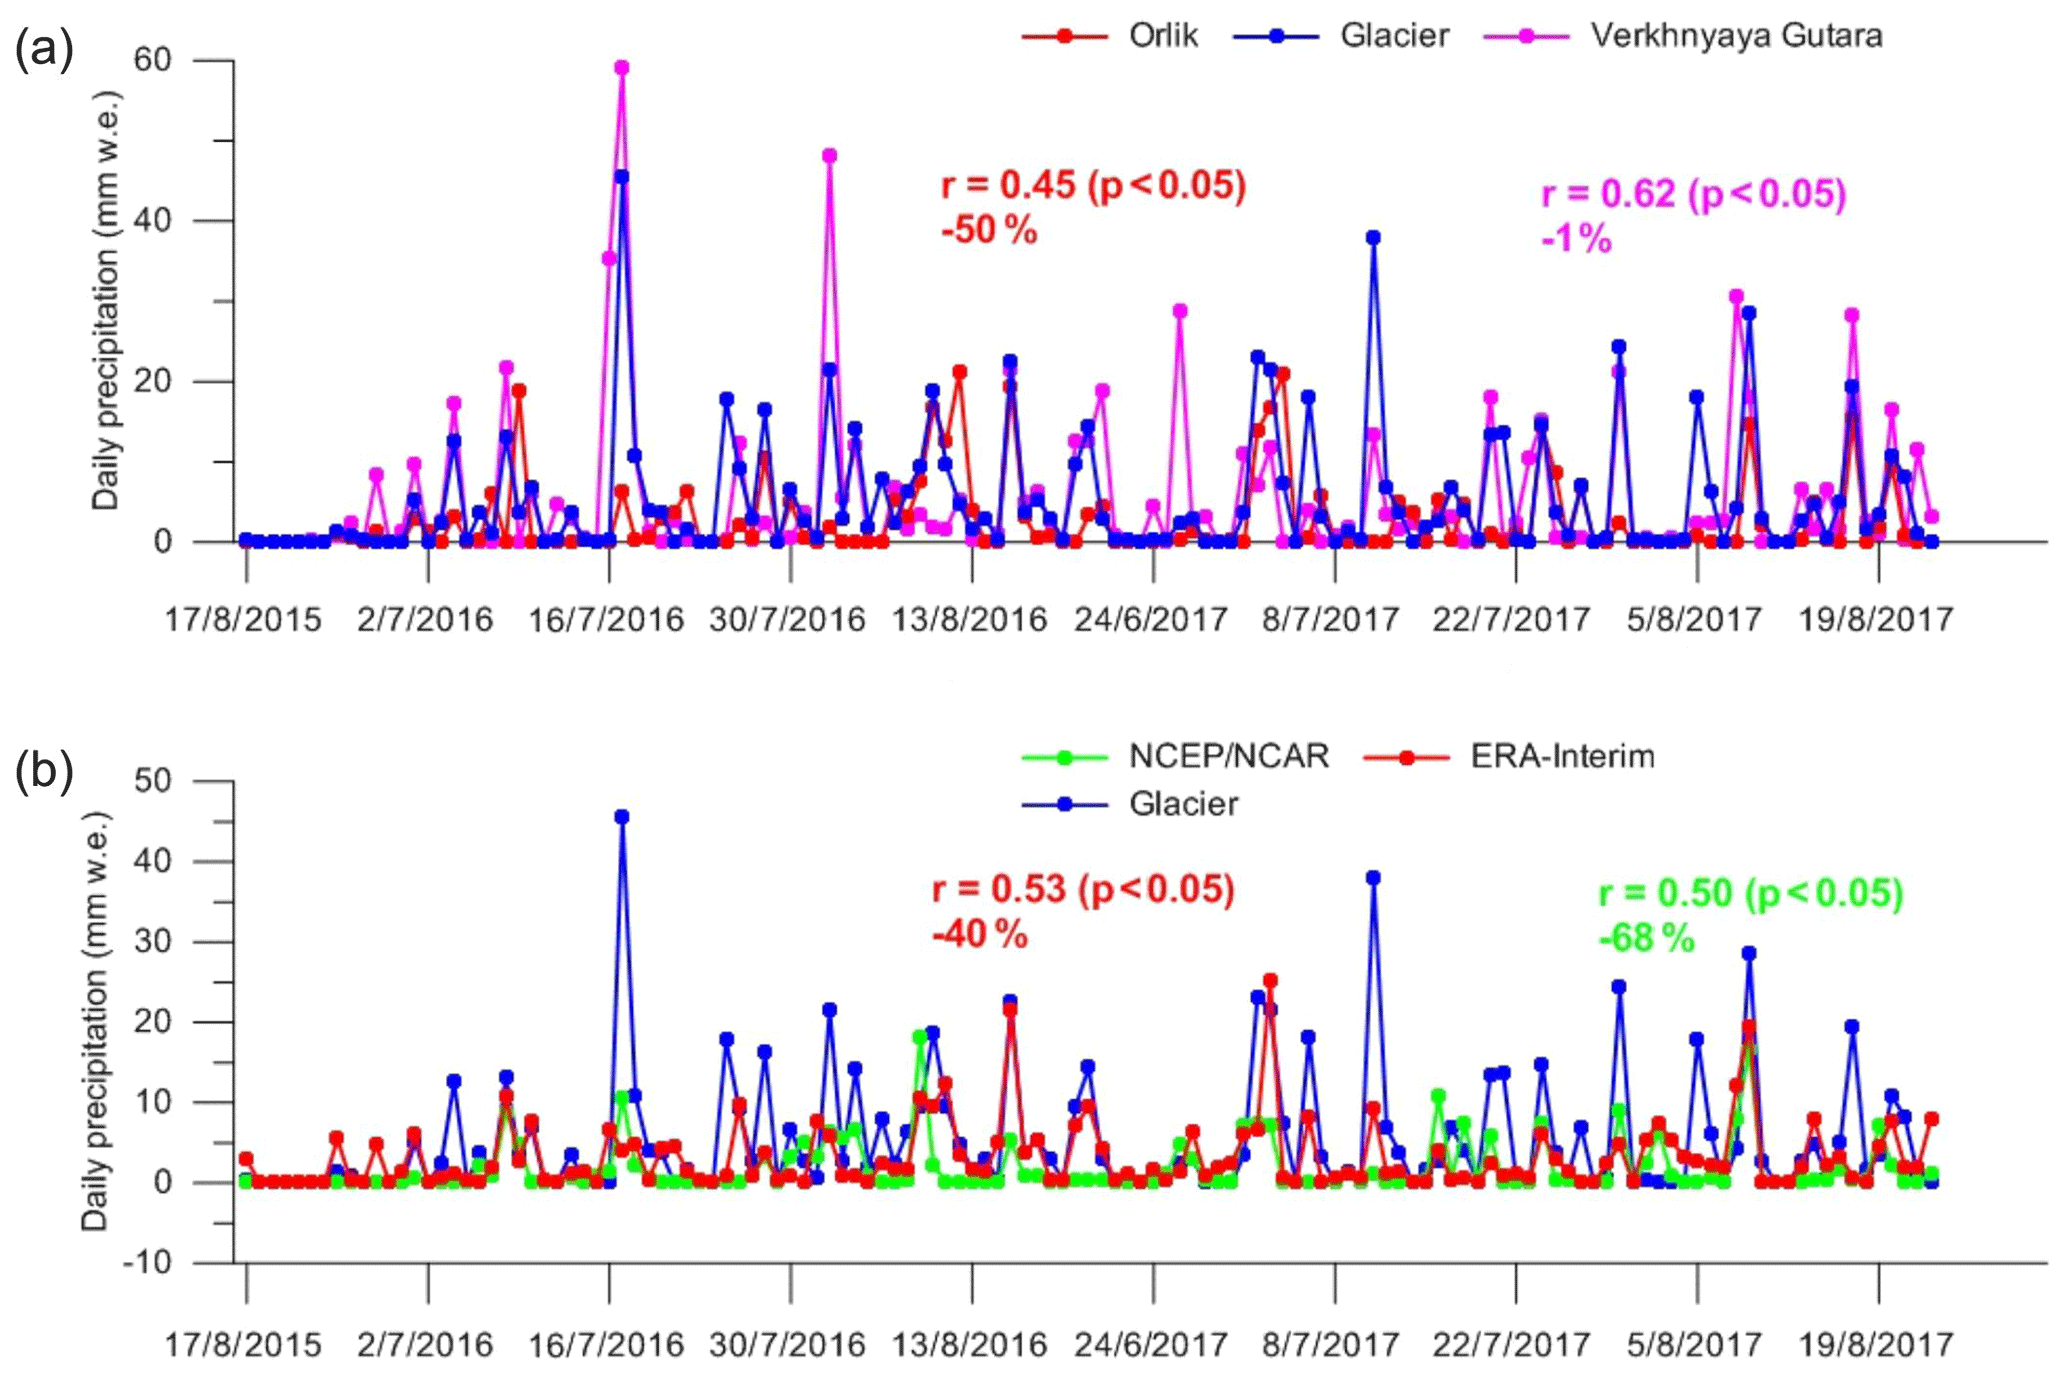
Figure 2Precipitation records from the glacier, weather stations Orlik and Verkhnyaya Gutara (a) and NCEP/NCAR and ERA-Interim reanalysis data (b).
In order to study precipitation regime over broader (regional) area we used the daily precipitation data from 11 regional weather stations of “Rosgidromet network” (Fig. 1a), 2.5×2.5∘ NCEP/NCAR (Kalnay et al., 1996) and 0.125×0.125∘ ERA Interim (Berrisford et al., 2011) reanalysis data. Studying of atmospheric circulation patterns during the precipitation days was based on synoptic maps (mean sea level, geopotential height at 700 and 500 hPa) and daily mean composite maps of geopotential height, vector wind, sea level pressure and precipitation rate provided by the NOAA/ESRL Physical Sciences Division, Boulder Colorado (http://www.esrl.noaa.gov/psd/, last access: 24 October 2019). Relation of precipitation with large-scale atmospheric circulation processes was analysed using classification of atmospheric circulation patterns in extra tropical latitudes of the Northern Hemisphere defined by Dzerdzeevskii (Dzerdzeevskii, 1962; Kononova, 2010). The basis of this classification was the occurrence or absence of blocking processes, their direction and frequency. The circulation processes were classified into 4 groups of circulation, which were further divided into 13 types and 41 sub-types or elementary circulation mechanisms (ECMs). Moisture sources were analysed using the HYSPLIT trajectory model data of NOAA Air Resources Laboratory (Stein et al., 2015). Backward trajectories were performed for 5 d intervals coming to the glacier site at 3000 m a.s.l. during the precipitation days of the 131 d record.
3.1 Precipitation regime
The 131 d precipitation record obtained from the glacier is shown in Fig. 2. The precipitation mainly fell in liquid form (90 %). In total, 100 of 131 d (80 %) were precipitated. Extreme precipitation (>30 mm d−1) was observed only for 2 d, on 17 July 2016 (46 mm), and on 11 July 2017 (38 mm). The precipitation record significantly correlates (correlation coefficients are from 0.45 to 0.62) with those from near located meteorological stations Orlik (1376 m a.s.l., east of the glacier) and Verkhnyaya Gutara (983 m a.s.l., north-west of the glacier). Total precipitation at Orlik underestimates that on the glacier by 50 %, while at Verkhnyaya Gutara it is quite similar to the glacier site. Similar correlations (correlation coefficients are from 0.50 to 0.53) were found for both reanalysis data. In general, these underestimate the measured precipitation by 40 % to 68 %. It should be noted that spatial resolution of ERA Interim is 20 times higher than NCEP/NCAR and better matches the observed summertime precipitation.
The comparison of precipitation regime (over the study period) on the glacier and 11 meteorological stations is presented in Fig. 3. On the glacier, rainfalls of low intensity (<10 mm d−1) prevailed in frequency (77 % of days, 35 % of total precipitation), while moderate rainfalls (21 % of days) brought the bulk of precipitated water (53 %). Extreme precipitation (>30 mm d−1, 2 d) accounted for 12 % of total amount. The precipitation regime similar to the glacial zone was found only at two weather stations located north-west (Verkhnyaya Gutara) and west (Olen'ya Rechka) of the glacier. The East Sayan range is a climate divide, separating more humid area on the south and southwest from more arid area in the north and northeast. A closer relationship between the precipitation regime on the glacier and western and north-western stations probably indicates a predominant western and north-western moisture transfer. The precipitation on the glacier did not show a clear daily cycle, but more precipitation falls in the afternoon and at the evening.
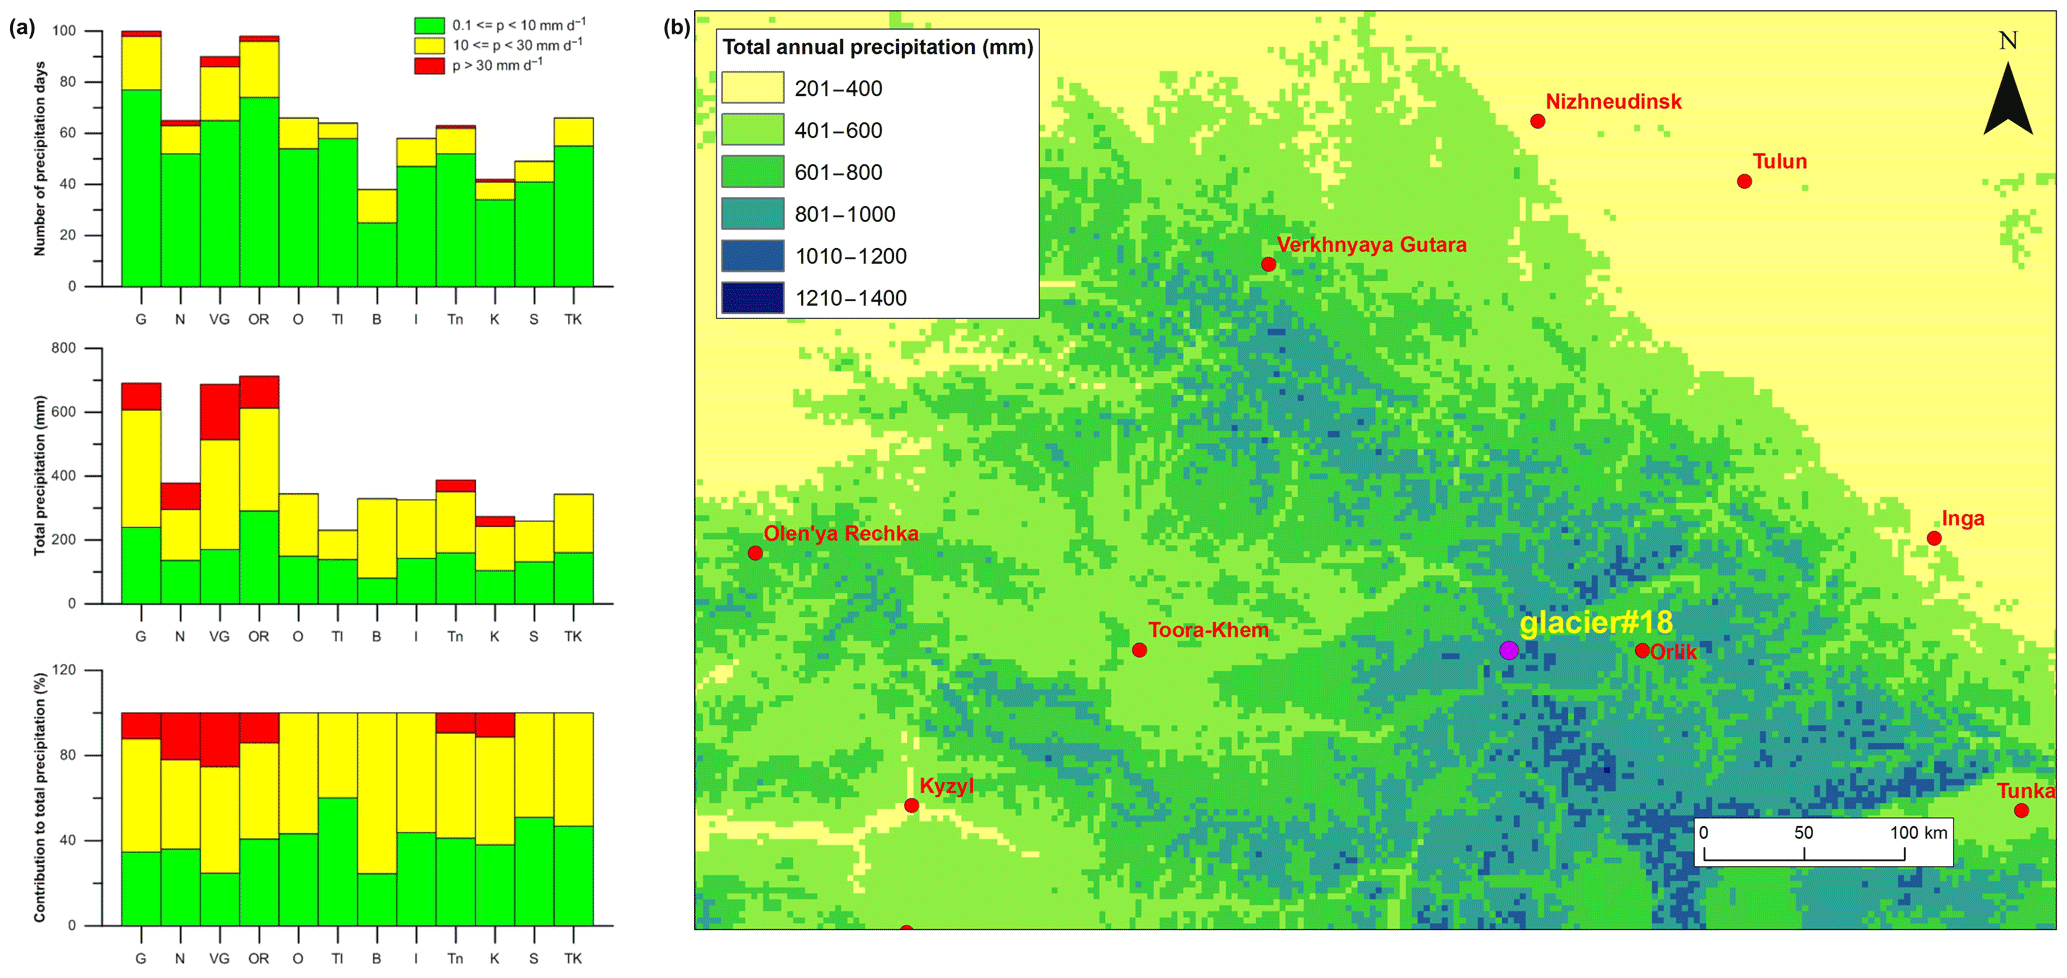
Figure 3Precipitation regime on the glacier #18 and 11 nearest weather stations (abbreviations correspond to those in Fig. 1) during the observation period 2015–2017 (a), and long-term annual precipitation map of the study area (b) produced by the authors using the rain gauges data (1964–2017 mean) from the 11 stations.
3.2 Atmospheric circulation patterns and moisture sources
Over the study period we defined 8 precipitation-bearing ECMs (3, 4b, 6, 8a, 9a, 10b, 12a, 12bs and 13s), however only one stands out very well (ECM 13s). This ECM is most typical in the Northern Hemisphere for summer period and belongs to the meridional southern group of circulation. It is characterized by cyclonic circulation over the Arctic, by absence of blockings and by 3 to 4 intrusions of southern cyclones (from low latitudes to high). It was characterized by both the largest number of days with precipitation (75 %) and precipitated water (81 %). On a regional scale, days with precipitation were associated with 3 types of baric fields (Fig. 4): cyclonic (24 % days and 49 % of precipitation), low-gradient cyclonic (44 % and 30 %) and anticyclonic (32 % and 21 %). It should be noted that the precipitation on the glacier in anticyclonic field was mostly associated with eastern periphery of anticyclones. At the same time, cyclones with atmospheric fronts were observed nearby the study area and could affect the precipitation. The low-gradient cyclonic pressure field was of the greatest duration and dominated by precipitation of low intensity (up to 10 mm). However, the greatest amount of precipitation (more intense and even extreme) fell in cyclonic field.
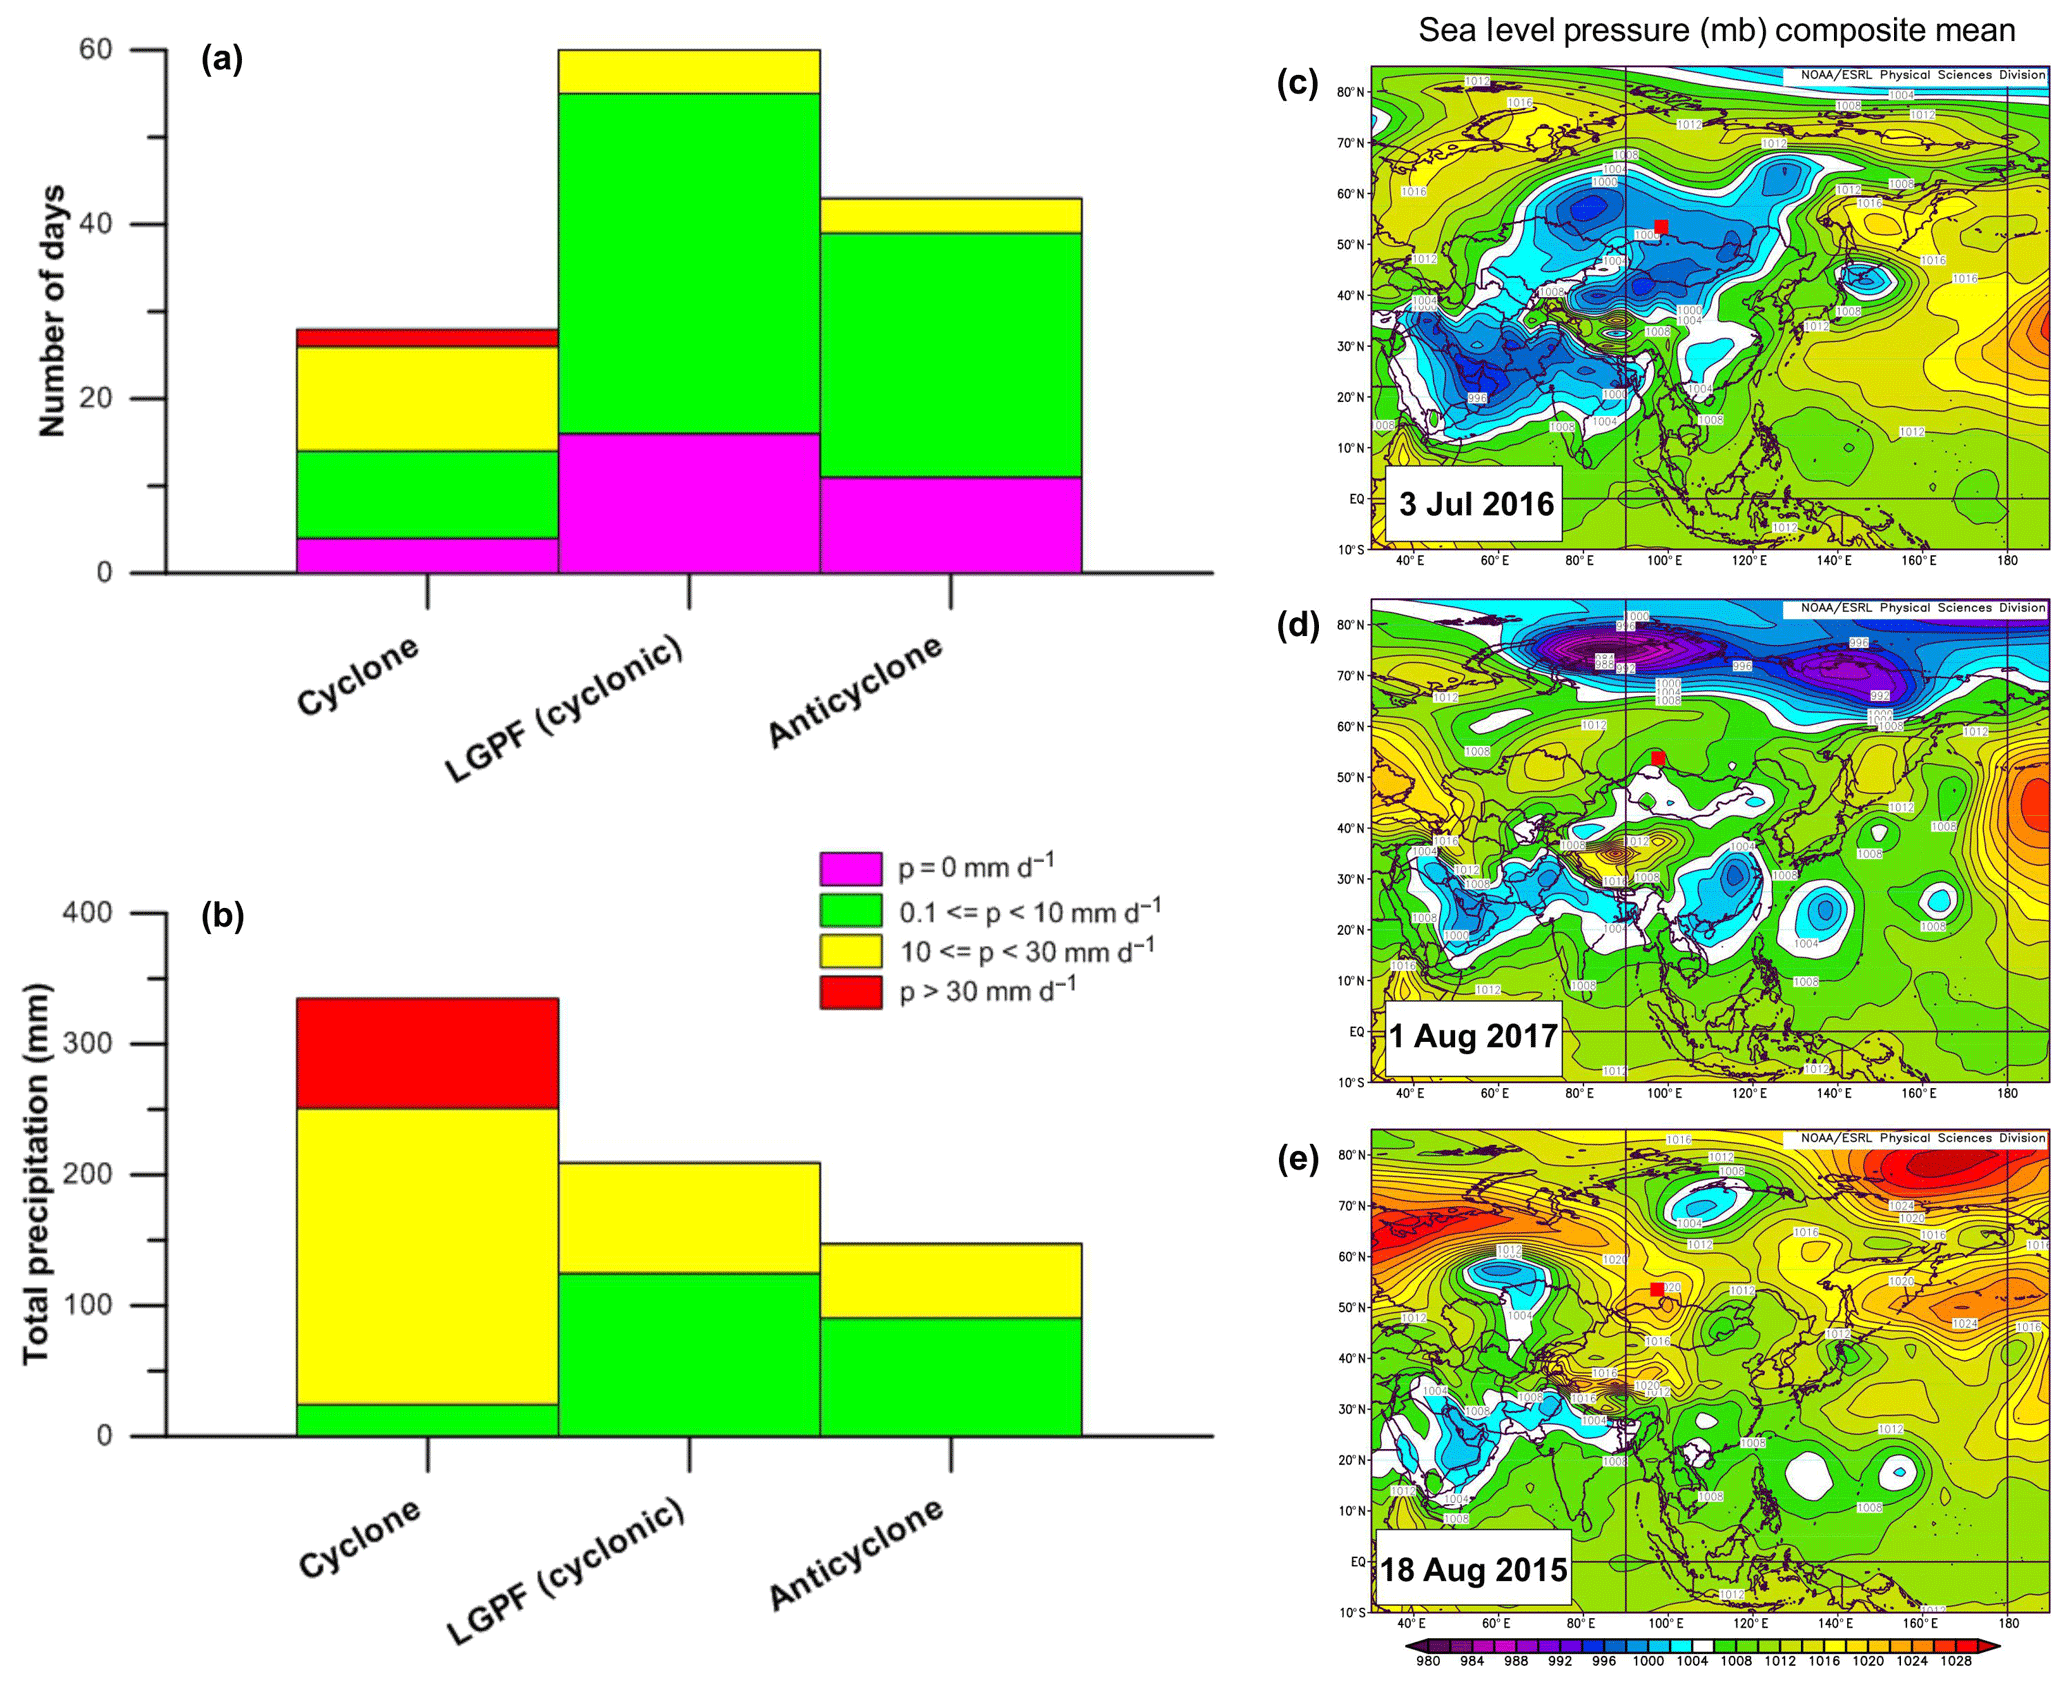
Figure 4Relationship between types of baric field over the East Sayan and the number of precipitation days (a) and total precipitation (b) on the glacier. Typical sea level pressure maps for cyclonic (c), low-gradient cyclonic (d), and anticyclonic (e) fields. LGPF means low gradient pressure field.
Frequency analysis of 5 d backward trajectories arriving at the glacier showed the main directions of moisture-bearing air masses (Fig. 5). In July 2016 (24 d with precipitation and 174 mm of precipitated water) western and north-western transport prevailed. Cyclonic circulation was observed over the Arctic, the Pacific maximum was clearly pronounced, and the study area was in the low pressure field. In August 2016 (25 d and 168 mm) multidirectional trajectories of moisture-bearing flows were observed, but the northern component prevailed. High pressure was over the European Russia, and anticyclone field prevailed over the study area. In July 2017 (26 d and 222 mm) western air transport bringing the moisture was dominant, however south-western and north-western components were also presented. The study area was characterized by low pressure field. In August 2017 (17 d and 118 mm) north-western directions were prevailed, while the East Sayan was in high pressure field. In general, the most of trajectories (79 %) began west of the glacier (south-western and north-western quadrants) and they accounted for 70 % of precipitated water. However, it should be noted that trajectories originated from the south-east quadrant (14 %) had a large proportion in total precipitation (25 %), mainly due to rainfalls of moderate and high intensity.
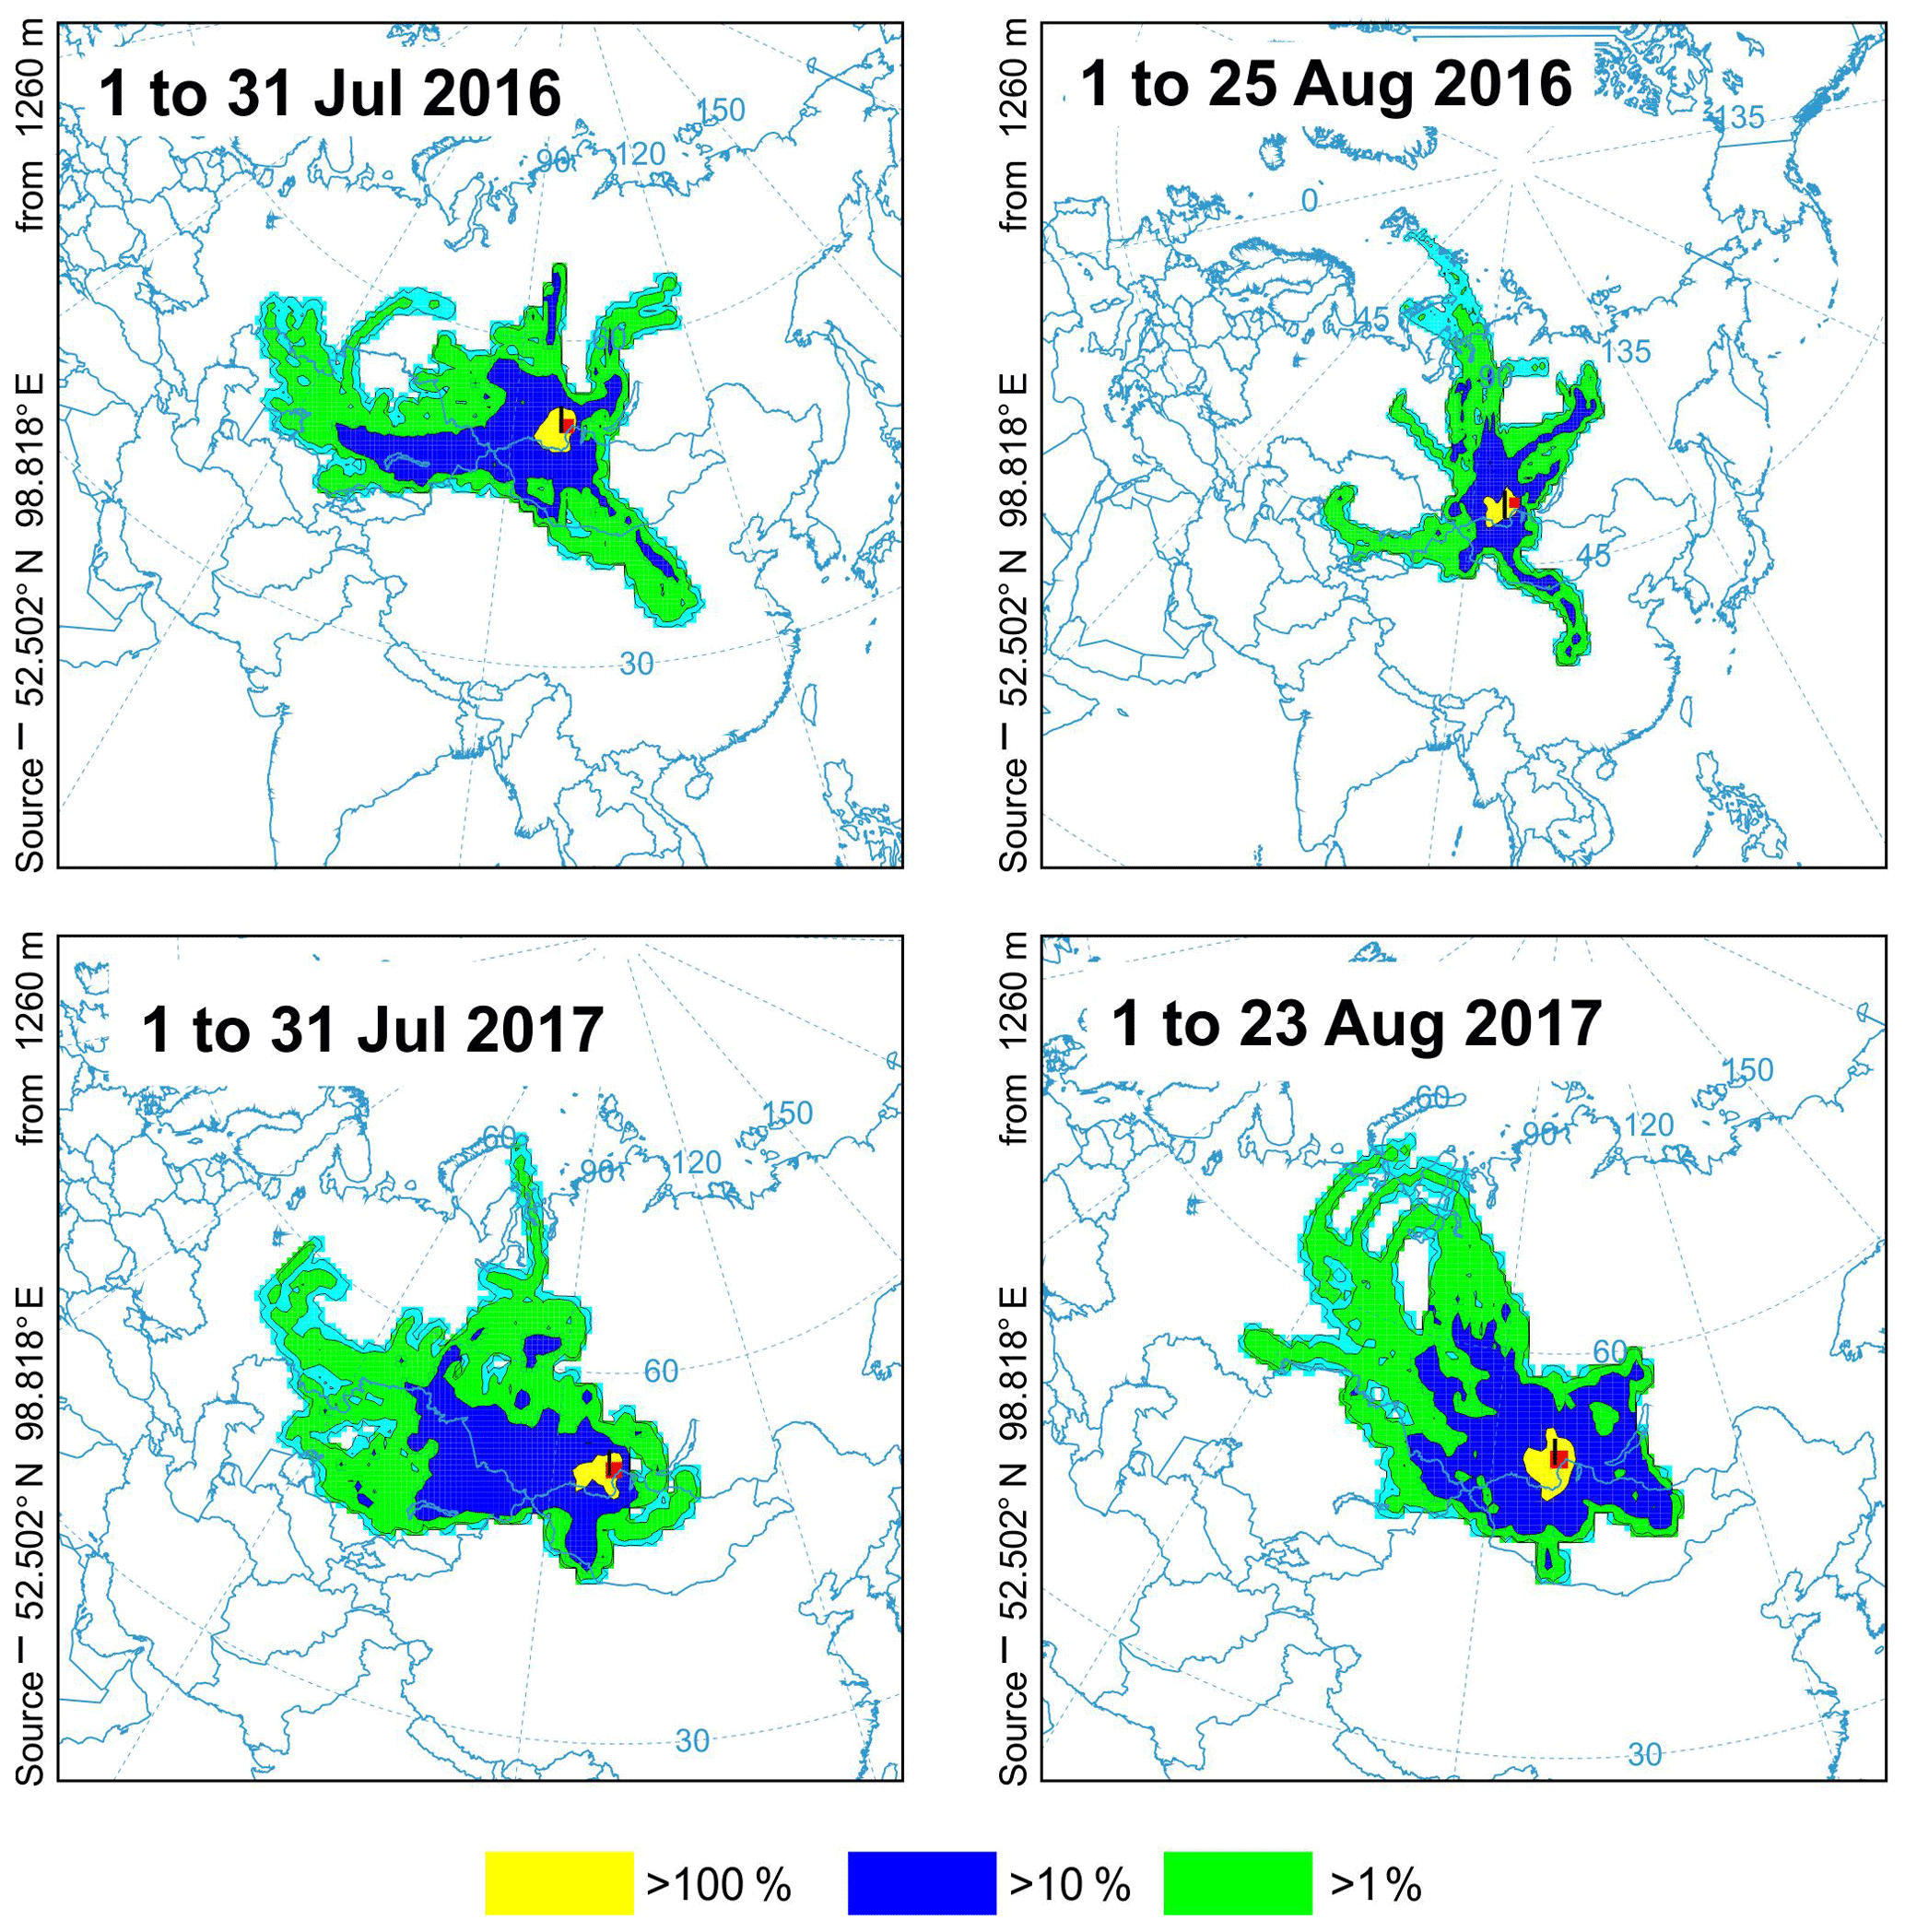
Figure 5Frequency maps of 5 d backward trajectories for July and August of 2016–2017 (days with precipitation).
Based on the precipitation record firstly obtained from high-mountain glacier and synoptic analysis we defined six regional (East Sayan) synoptic patterns for all days with precipitation (Fig. 6). These are characterized by: (1) Mediterranean cyclones regenerated on the Mongolian branch of the polar front (ES01), (2) polar front cyclones coming from the north, north-west and north-east (ES02), (3) anticyclones centred over Lake Baikal and Far East and large depression over the North Siberia (ES03), (4) anticyclones over the West Mongolia and cyclonic circulation over the Arctic (ES04), (5) low-gradient pressure field over the East Sayan and high pressure over the Arctic (ES05), and (6) low-gradient pressure field over the East Sayan with low pressure over the Arctic (ES06). The maximum precipitation was attributed to ES06, while the minimum to ES03 and ES05. It should be noted that although the total duration of ES01 and ES02 was only 20 d they contributed 41 % of total precipitation. These both types were characterized by extreme precipitation events. In both extreme events (17 July 2016 and on 11 July 2017) heavy rainfalls were associated with cyclones. In the first event it was a Mediterranean cyclone regenerated on the Mongolian branch of polar front (ES01), while in the second one it was a northern cyclone (ES02). Such kind of extreme precipitation events, which falls in short time in mountains catchments, can provoke intensive snow/ice melting and drastic increase of water level in mountain rivers. In turn it may case catastrophic floods in foothills, one of which happened in 2019 summer on the north-east slope of the East Sayan (Floods in Irkutsk region, 2020; https://tass.com/floods-in-irkutsk-region, last access: 14 January 2020).
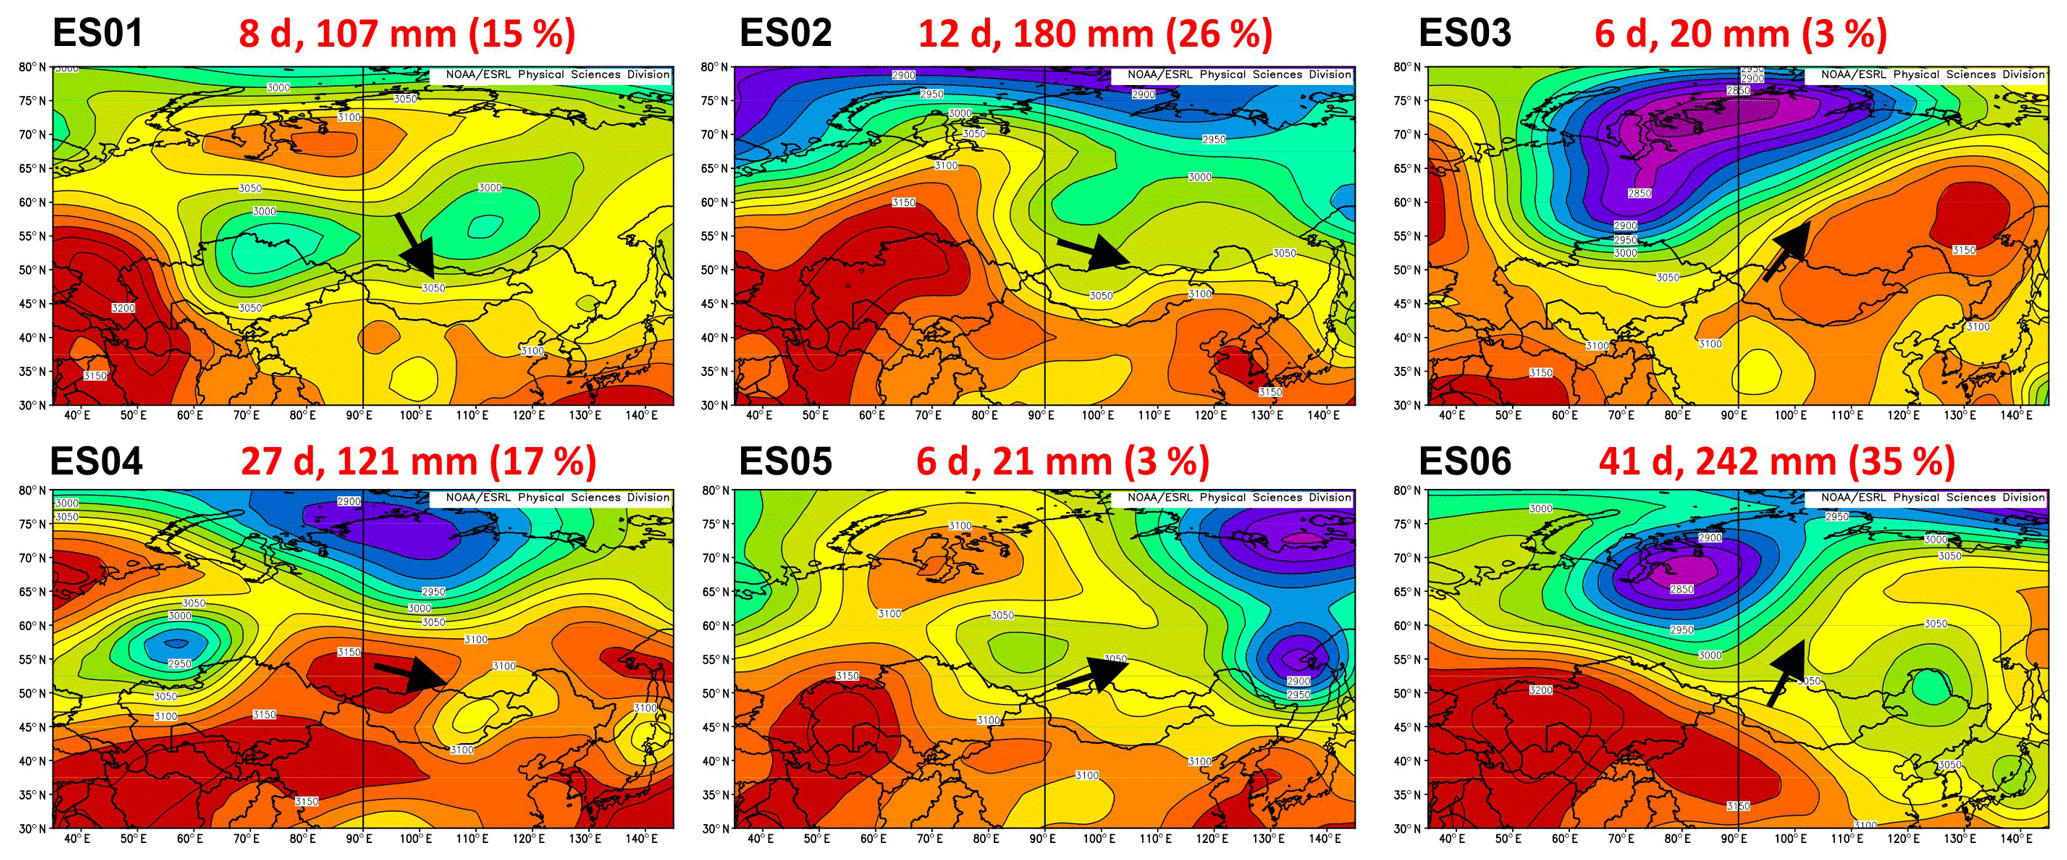
Figure 6Synoptic patterns allocated for days with precipitation on the glacier (maps of 700 hPa surface). For each type, the duration (in d) and total amount of precipitation (in mm and %) are indicated. Black arrows indicate leading airflows in low troposphere (700 hPa level) over the study area.
Firstly, using automatic weather station during three summer periods (2015–2017), we obtained the 131 d precipitation record from the high-mountain glacier (No. 18), located on the East Sayan Range, south of East Siberia. The record was correlated with different scale atmospheric circulation mechanisms. Rainfall mode similar to that on the glacier was found at weather stations located west and northwest, while ERA Interim and NCEP/NCAR reanalysis data underestimate precipitation in the high-mountain catchment by 40 % and 70 %, respectively. Most of summer rainfalls in glacial zone were associated with the meridional southern group of large scale circulation (Dzerdzeevskii's classification for the Northern Hemisphere) characterized by cyclonic circulation over the Arctic and intrusions of southern cyclones (ECM 13s). On a regional scale, days with precipitation were associated with three types of baric fields, cyclonic (49 % of precipitation), low-gradient cyclonic (30 %) and anticyclonic (21 %). The most of summer precipitation (70 %) came to the glacier from west, while about 25 % of total precipitation (mainly of moderate to strong intensity) was originated from the south-east (Pacific monsoon). Six atmospheric circulation patterns over the East Sayan were identified for days with precipitation over the study period. The maximum precipitation was found for type ES06 (low-gradient pressure field over the East Sayan with low pressure over the Arctic), with regenerated Mediterranean cyclones and polar front cyclones contributing 41 % of total precipitation, including extreme precipitation events.
The original observation database of precipitation on the glacier is the intellectual property of Limnological Institute SB RAS (contact the authors of this paper for data requests). Data of elementary circulation mechanisms (ECMs) of the Northern Hemisphere by Dzerdzeevskii with daily resolution is accessible at http://atmospheric-circulation.ru/wp-content/uploads/2019/05/Kalendar-posledovatelnoj-smeny-ECM-po-dniam-za-1899-2018.xlsx, last access: 10 December 2019) (Kononova, 2019). The meteorological data (with daily resolution) of 11 used weather stations is available on “All Russian Research Institute of Hydrometeorological Information – World Data Centre (RIHMI-WDC)” website (http://meteo.ru/data/162-temperature-precipitation, last access: 7 November 2019) (Bulygina et al., 2019). The NCEP/NCAR reanalysis data is available on ESRL/PSD website (https://www.esrl.noaa.gov/psd/data/reanalysis/reanalysis.shtml, last access: 18 August 2019) (Kalnay et al., 1996), and ERA Interim reanalysis data is available on ECMWF website (https://www.ecmwf.int/en/forecasts/datasets/reanalysis-datasets/era-interim, last access: 18 Aug 2019) (Berrisford et al., 2011).
EYO designed this study, performed field measurements of precipitation on the glacier and wrote the original draft. OPO performed the analysis of weather stations data and atmospheric circulation patterns.
The authors declare that they have no conflict of interest.
This article is part of the special issue “19th EMS Annual Meeting: European Conference for Applied Meteorology and Climatology 2019”. It is a result of the EMS Annual Meeting: European Conference for Applied Meteorology and Climatology 2019, Lyngby, Denmark, 9–13 September 2019.
We thank Andrey Fedotov, Konstantin Vershinin, Ilya Enushchenko and Vladimir Isaev who participated in field works. The authors gratefully acknowledge the NOAA Air Resources Laboratory (ARL) for the provision of the HYSPLIT transport and dispersion model and/or READY website (https://www.ready.noaa.gov, last access: 24 October 2019) used in this publication.
This research has been supported by the Russian Foundation for Basic Research (grant no. 19-05-00668).
This paper was edited by Renato R. Colucci and reviewed by Nina Kononova, Natalia Kichigina, and one anonymous referee.
Antokhina, O. Y., Antokhin, P. N., Martynova, Y. V., and Mordvinov, V. I.: The impact of atmospheric blocking on spatial distributions of summertime precipitation over Eurasia, IOP Conf. Ser. Earth Environ. Sci., 48, 12035, https://doi.org/10.1088/1755-1315/48/1/012035, 2016.
Berrisford, P., Dee, D. P., Poli, P., Brugge, R., Fielding, M., Fuentes, M., Kållberg, P.W., Kobayashi, S., Uppala, S., and Simmons, A.: The ERA-Interim archive Version 2.0, ERA Report Series, ERA Report, ECMWF, Shinfield Park, Reading, 2011.
Bulygina, O. N., Razuvaev, V. N., and Aleksandrova, T. M.: Description of the data set of daily air temperature and precipitation at the meteorological stations of Russia and former USSR, available at: http://meteo.ru/data/162-temperature-precipitation, last access: 7 November 2019.
Dzerdzeevskii, B.: Fluctuations of climate and of general circulation of the atmosphere in extra-tropical latitudes of the Northern Hemisphere and some problems of dynamic climatology, Tellus A, 14, 328–336, 1962.
Floods in Irkutsk region: https://tass.com/floods-in-irkutsk-region, last access: 14 January 2020.
Kalnay, E., Kanamitsu, M., Kistler, R., Collins, W., Deaven, D., Gandin, L., Iredell, M., Saha, S., White, G., Woollen, J., Zhu, Y., Leetmaa, A., Reynolds, R., Chelliah, M., Ebisuzaki, W., Higgins, W., Janowiak, J., Mo, K. C., Ropelewski, C., Wang, J., Jenne, R., and Joseph, D.: The NCEP/NCAR 40-Year Reanalysis Project, B. Am. Meteorol. Soc., 77, 437–471, https://doi.org/10.1175/1520-0477(1996)077<0437:TNYRP>2.0.CO;2, 1996.
Kononova, N.: Long-term fluctuations of the northern hemisphere atmospheric circulation according to Dzerdzeevskii's classification, Geogr. Environ. Sustainabil., 3, 25–43, 2010.
Kononova, N. K.: Fluctuations in the circulation of the atmosphere of the northern hemisphere in the 20th–early 21st centuries, Daily calendar of sequential change of ECMs, available at: http://atmospheric-circulation.ru/datas/, last access: 10 December 2019.
Osipov, E. Y. and Osipova, O. P.: Mountain glaciers of southeast Siberia: current state and changes since the Little Ice Age, Ann. Glaciol., 55, 167–176, https://doi.org/10.3189/2014AoG66A135, 2014.
Osipov, E. Y. and Osipova, O. P.: Glacier changes on the Pik Topografov massif, East Sayan Range, Southeast Siberia, from remote sensing data, Geosciences, 8, 1–12, https://doi.org/10.3390/geosciences8050148, 2018.
Osipov, E. Y., Osipova, O. P., and Klevtsov, E. V.: Inventory of glaciers in the Eastern Sayan on the basis of space surveys, Led i Sneg, 57, 483–497, https://doi.org/10.15356/2076-6734-2017-4-483-497, 2017.
Osipova, O. P. and Osipov, E. Y.: Relationship between glacier melting and atmospheric circulation in the southeast Siberia, IOP Conf. Ser. Earth Environ. Sci., 107, 12039, https://doi.org/10.1088/1755-1315/107/1/012039, 2018.
Osipova, O. P. and Osipov, E. Y.: Atmospheric Circulation Processes and Precipitation Regime in the Northern Part of the Baikal Mountain Region, Russ. Meteorol. Hydrol., 44, 695–703, https://doi.org/10.3103/S106837391910008X, 2019a.
Osipova, O. P. and Osipov, E. Y.: Meteorological regime of the glacier No. 18 (the Peak Topografov massiv, East Sayan range), IOP Conf. Ser. Earth Environ. Sci., 381, 12071, https://doi.org/10.1088/1755-1315/381/1/012071, 2019b.
Stein, A. F., Draxler, R. R, Rolph, G. D., Stunder, B. J. B., Cohen, M. D., and Ngan, F.: NOAA's HYSPLIT atmospheric transport and dispersion modeling system, B. Am. Meteorol. Soc., 96, 2059–2077, https://doi.org/10.1175/BAMS-D-14-00110.1, 2015.