 | 04 Jun 2019
Sensitivity of nocturnal low-level jets to land-use parameters and meteorological quantities
Astrid Ziemann
Manuela Starke
Tina Leiding
The increasing hub height of wind turbines aims at optimizing the wind energy yield at one location and offers the possibility to provide new areas for wind power, for example forests. Inhomogeneous environmental conditions of locations for wind turbines as well as the hub heights of more than 100 m cause challenges for flow models and their potential for wind power assessment. This includes special features of the wind field like low-level jets (LLJs), frequently observed local wind maxima in the nocturnal boundary layer. To characterize the dependencies of LLJs, the micro-scale model HIRVAC2D (HIgh Resolution Vegetation Atmosphere Coupler 2D) is applied in the study.
The model HIRVAC2D is capable of modelling different vegetation types by explicitly considering the highly resolved structure of varying plant parameters. Beyond that, the model enables the resolution of temporally variable atmospheric circulation patterns during day- and night-time with typical thermal stratifications. In this way, HIRVAC2D is suitable to capture the nocturnal LLJ development and its characteristics. Results of several HIRVAC2D simulations are presented in order to deduce quantitatively the sensitivity of LLJs to vegetation and model parameters as well as meteorological quantities. It is shown that the geostrophic wind speed is an important criterion for the development of LLJs within a height range between 50 and 300 m. For a geostrophic wind speed of 4 m s−1, a nocturnal LLJ occurs remarkably more frequent as for a wind speed of 10 m s−1. To interpret and evaluate this result regarding possible wind power applications, a frequency distribution of the geostrophic wind speed was calculated over 30 years exemplarily at two locations using the meso-scale model COSMO in climate mode. Additionally, the type of land use has an impact on the height and intensity of LLJs. For a grassland site, the nocturnal LLJ is noticeably more frequent in the considered height range, but with a smaller wind speed and at a lower height above ground in comparison to deciduous or coniferous forests.


The hub height of wind turbine rotors has increased in recent years and has achieved heights of over 100 m above ground surface for newly installed onshore wind turbines in Germany (Deutsche WindGuard, 2017). This leads to an optimization of the yield due to increasing wind speed with height. Additionally, new areas for wind energy become accessible, e.g. forest areas. To investigate, if the wind field at hub heights is influenced by the characteristics of the land use, suitable atmospheric boundary layer (ABL) models should be applied. Furthermore, it has to be ensured that the typical daily and seasonal periodic interactions between the airflow and other meteorological fields are realistically modelled.
One phenomenon of the wind field at heights above 100 m is the so-called low-level jet (LLJ). Nocturnal LLJs considered in this paper originate from an inertial oscillation, which develops above a stably stratified layer (Stull, 1988). When around sunset stable stratification develops during a cloudless night, the upper part of the former mixed layer becomes decoupled from the surface. In this air layer, the daytime balance of forces is disturbed due to the absent influence of friction. Consequently, the Coriolis force induces a wind vector oscillation around the geostrophic wind, producing a frequently supergeostrophic wind speed during the night. The resulting LLJ is characterized by a maximum in the wind speed profile, which can be typically observed between 100 and 500 m above the ground surface (e.g., Baas et al., 2009).
The presence of LLJs has several impacts for wind energy production. High wind speeds associated with the jet are favourable and lead to higher power generation (e.g., Storm et al., 2009). Depending on the geographical region, LLJs can be responsible for a large fraction of power generation. Wilczak et al. (2014) reported for the Great Plains in the United States that LLJs during nocturnal hours drive capacity factors to over 60 %. At the same time, the enhanced vertical wind shear and intermittent turbulence can negatively affect wind turbines due to cyclical aerodynamic loads on the turbine blades (e.g., Gutierrez et al., 2016).
The phenomenon of LLJs has been investigated for many years beginning with the work of Lettau (1954) and Blackadar (1957), see the overview by Emeis (2014). Meanwhile, LLJ climatologies based on measurements by meteorological masts (e.g., Kottmeier et al., 1983), remote sensing devices (e.g., Emeis, 2014) or a combination of both techniques (e.g., Baas et al., 2009) are available. These observations show similar properties of LLJs, however, a unique definition of LLJs does not exist (Gross, 2012). This is also the reason for different frequencies of occurrence of a nocturnal LLJ, which is given by Kottmeier et al. (1983) as 10 % and by Emeis (2014) as 20 % of all nights for northern Germany. Independent from the absolute number of occurrence it is evident, that the LLJ is a regular night-time feature (e.g., Lampert et al., 2016).
Besides measurements, modelling of the nocturnal boundary layer including the development of LLJs for a realistic situation and environment is still a challenge (Gross, 2012). In practice, approximations like the logarithmic wind profile are commonly adopted for an extrapolation of wind information to hub height. Especially during night-time with stable stratification and a LLJ development, the logarithmic law results in a significant underestimation of the wind speed (Storm et al., 2009). Additionally it is important to note that existing standards (e.g. by the International Electrical Commission, IEC) for wind power industries cannot represent strong wind shear associated with LLJs (Kalverla et al., 2019).
Information about LLJ characteristics at a specific location is necessary to take into account this phenomenon for possible wind energy applications (Lampert et al., 2016). Essential features of LLJs, e.g. altitude, duration, intensity, and wind shear in comparison to the large-scale wind field, are dependent on the meteorological boundary conditions, e.g. the geostrophic wind speed. Due to the possible increase in yield, but also the mechanical load on wind turbines, there is a great need for temporally and spatially resolved atmospheric model studies on LLJs (Storm et al., 2009). Nowadays, there are several studies on LLJs applying meso- or micro-scale, one- up to three-dimensional models of the atmosphere. Sanz Rodrigo et al. (2017) developed a methodology for a benchmark test of ABL models for wind energy applications including the case of nocturnal LLJs. Thereby, single-column Reynolds-averaged Navier-Stokes (RANS) models were applied to simulate the wind field over horizontally homogeneous terrain. To incorporate heterogeneous conditions of the surface, higher-dimensional models are needed. The potential of the three-dimensional Weather Research and Forecasting (WRF) model in forecasting two nocturnal LLJ events was investigated by Storm et al. (2009). WRF was used in the meso-scale modelling version with horizontal grid spacing of 4 km. All WRF configurations do have the capability to capture some of the essential characteristics of observed LLJ events (location and timing), but the model overestimates the height and underestimates the wind speed of the jets. This result is likely caused by the used boundary layer parameterization, which is tuned to the meso-scale model resolution. A vertical displacement of LLJs in meso-scale data was also detected by Kalverla et al. (2019) using the ERA5 reanalysis data for LLJs over North Sea. Adequate boundary layer parameterization schemes together with highly resolved micro-scale models are needed to detect all LLJ characteristics with high accuracy.
Additionally, the diversity of land uses in Central Europe demands to investigate LLJ dependencies on the kind of land use and vegetation parameters (e.g., plant area density and vegetation height). This issue is also relevant for wind energy applications because wind farms in more heterogeneous onshore areas are being developed to respond the increasing demand for onshore wind power. When exploring such sites, new challenges arise for modelling wind fields due to higher turbulence levels and wind shear. Especially forest stands are vertically distributed sources and sinks for the exchange of momentum and heat between the vegetation elements and the airflow. Nowadays, the wind energy community also applies forest flow models that use the spatially resolved plant area density (PAD) derived from airborne laser scans (ALSs). Ivanell et al. (2018) described results of a benchmark test of several micro-scale models including a vegetation parameterization scheme using PAD measured by ALS. Such models could potentially replace simple standardized approximations for the extra- or interpolation of measured wind fields at locations with forests and/or heterogeneous vegetation parameters. So far, the focus of model studies was on stationary conditions with neutral stratification (Ivanell et al., 2018), i.e. LLJ events were not yet considered.
The present study attempts to fill this gap by applying a state-of-the-art micro-scale model that is able to describe the development of the atmospheric boundary layer including the nocturnal LLJ with high spatio-temporal resolution over surfaces with different kinds of land use. This investigation is part of the project “Quantitative wind climatology for wind energy applications at heights above 100 m” (QuWind100). The main objective of QuWind100 is to derive a wind climatology for altitudes between 100 and 200 m above ground as ready for use database for current and future wind power applications in Germany. A long-term wind climatology is typically determined from a combination of measurements and meso-scale model simulations with horizontal resolution of a few kilometres. The transition from meso- to microscale to provide the needed wind field data at a location is the main challenge for the next generation of wind assessment tools (Sanz Rodrigo et al., 2017). This background motivates the project QuWind100 to build up a model chain with a three-dimensional regional climate model and a two-dimensional boundary layer model. A special feature of the ABL model is the high vertical resolution and transient simulation of the influence of realistic vegetation stands on the wind field including the development of LLJs. Sensitivity analyses of the ABL model help to determine, which are the most important drivers of the model that affect the LLJ occurrence, jet speed, and jet height.
The organization of the paper is as follows: Sect. 2 provides an overview of the micro- and meso-scale numerical models applied in this study and the simulated database. In Sect. 3.1, exemplary results of the sensitivity study of the micro-scale model regarding influences on the nocturnal LLJ characteristics are presented. Section 3.2 addresses the main influence on the occurrence of nocturnal LLJs, the geostrophic wind speed. The climatological frequency distribution of geostrophic wind speed is shown by means of examples at two locations in Germany. Concluding remarks and an outlook to future investigations are given in Sect. 4.
To quantify several influences on the properties of LLJs, numerical simulations were performed using the two-dimensional (2-D) model version of HIRVAC (HIgh Resolution Vegetation Atmosphere Coupler; Mix et al., 1994; Ziemann, 1998). This performance-optimized boundary-layer model is particularly suitable for sensitivity studies, which allow the separate analysis of temporal and spatial effects on the wind field, i.a. at altitudes above 100 m, under conditions of a “virtual” laboratory. The main three sub-models of HIRVAC2D describe the atmosphere, the vegetation, and the soil. Special features of HIRVAC2D are the high vertical resolution (about 60 model layers up to a height of 30 m above ground surface to highly resolve the vegetation) and the transient simulation of wind fields within and above realistic vegetation stands (Queck et al., 2015). In comparison to Queck et al. (2015) a non-stationary model version was applied for this study. The basis system of equation includes the Reynolds-averaged equations for motion, heat exchange, and turbulent kinetic energy, which are numerically solved. The RANS model considers the effect of Coriolis force that induces the inertial oscillation of the wind vector resulting in the development of nocturnal LLJ. To include the effects of vegetation elements, additional terms in the prognostic equations are used to simulate the exchange between the ABL and the vegetation at every model level. In this way, daily courses of wind vector can be simulated and analyzed in their seasonal variability depending on the vegetation properties. This enables to quantify the effect of different types of surfaces on the development of LLJs in space and time.
The one-dimensional version of HIRVAC was already applied for sites with different land uses and compared with several other models and observational data (Fischer et al., 2008; Falge et al., 2005). Recently, HIRVAC2D was tested at the micro-meteorological site Tharandt forest, where PAD data with a resolution of 1 m3 are provided by ALS (Queck et al., 2015). Previous comparisons between model and observational data were focused on the near-surface vertical air layer depending on the data of measuring towers up to a height of 42 m above ground. So far, a model evaluation for the simulated data at the height of wind turbines is missing. Meanwhile, wind speed data are provided by continuous measurements of a SODAR over two months in 2016 and temporary ascends of a captive balloon at the Tharandt forest site. Nocturnal low-level jet events were also observed during this special observational period. It is planned to compare adjusted HIRVAC2D simulations with these measurement results in near future.
More than 1000 simulations were performed using different types of land use and canopy parameters, e.g. different vertical profiles of PAD describing the distribution of vegetation elements (Fig. 1). Furthermore, meteorological conditions were changed (especially the geostrophic wind speed from 2 m s−1 up to 20 m s−1) as well as the kind of turbulence closure. In Sect. 3.1, a selection of HIRVAC2D results regarding the influence of land use and vegetation parameters on LLJ properties are shown: We investigated 409 numerical simulations especially with different vegetation parameters for vg=4 m s−1 and 469 simulations for vg=10 m s−1 for the same kind of turbulence closure in the model. Only successful and completed simulation runs were analysed. Table 1 provides an overview to the variability of important model parameters. To solve the system of basic equations in HIRVAC2D (Queck et al., 2015), a 1.5-order turbulence closure (Mix et al., 1994; Ziemann, 1998) was applied using the prognostic equation of turbulent kinetic energy and an adequate mixing length approach to derive the turbulent diffusion.
Table 1Summary of important model parameters for HIRVAC2D sensitivity study.
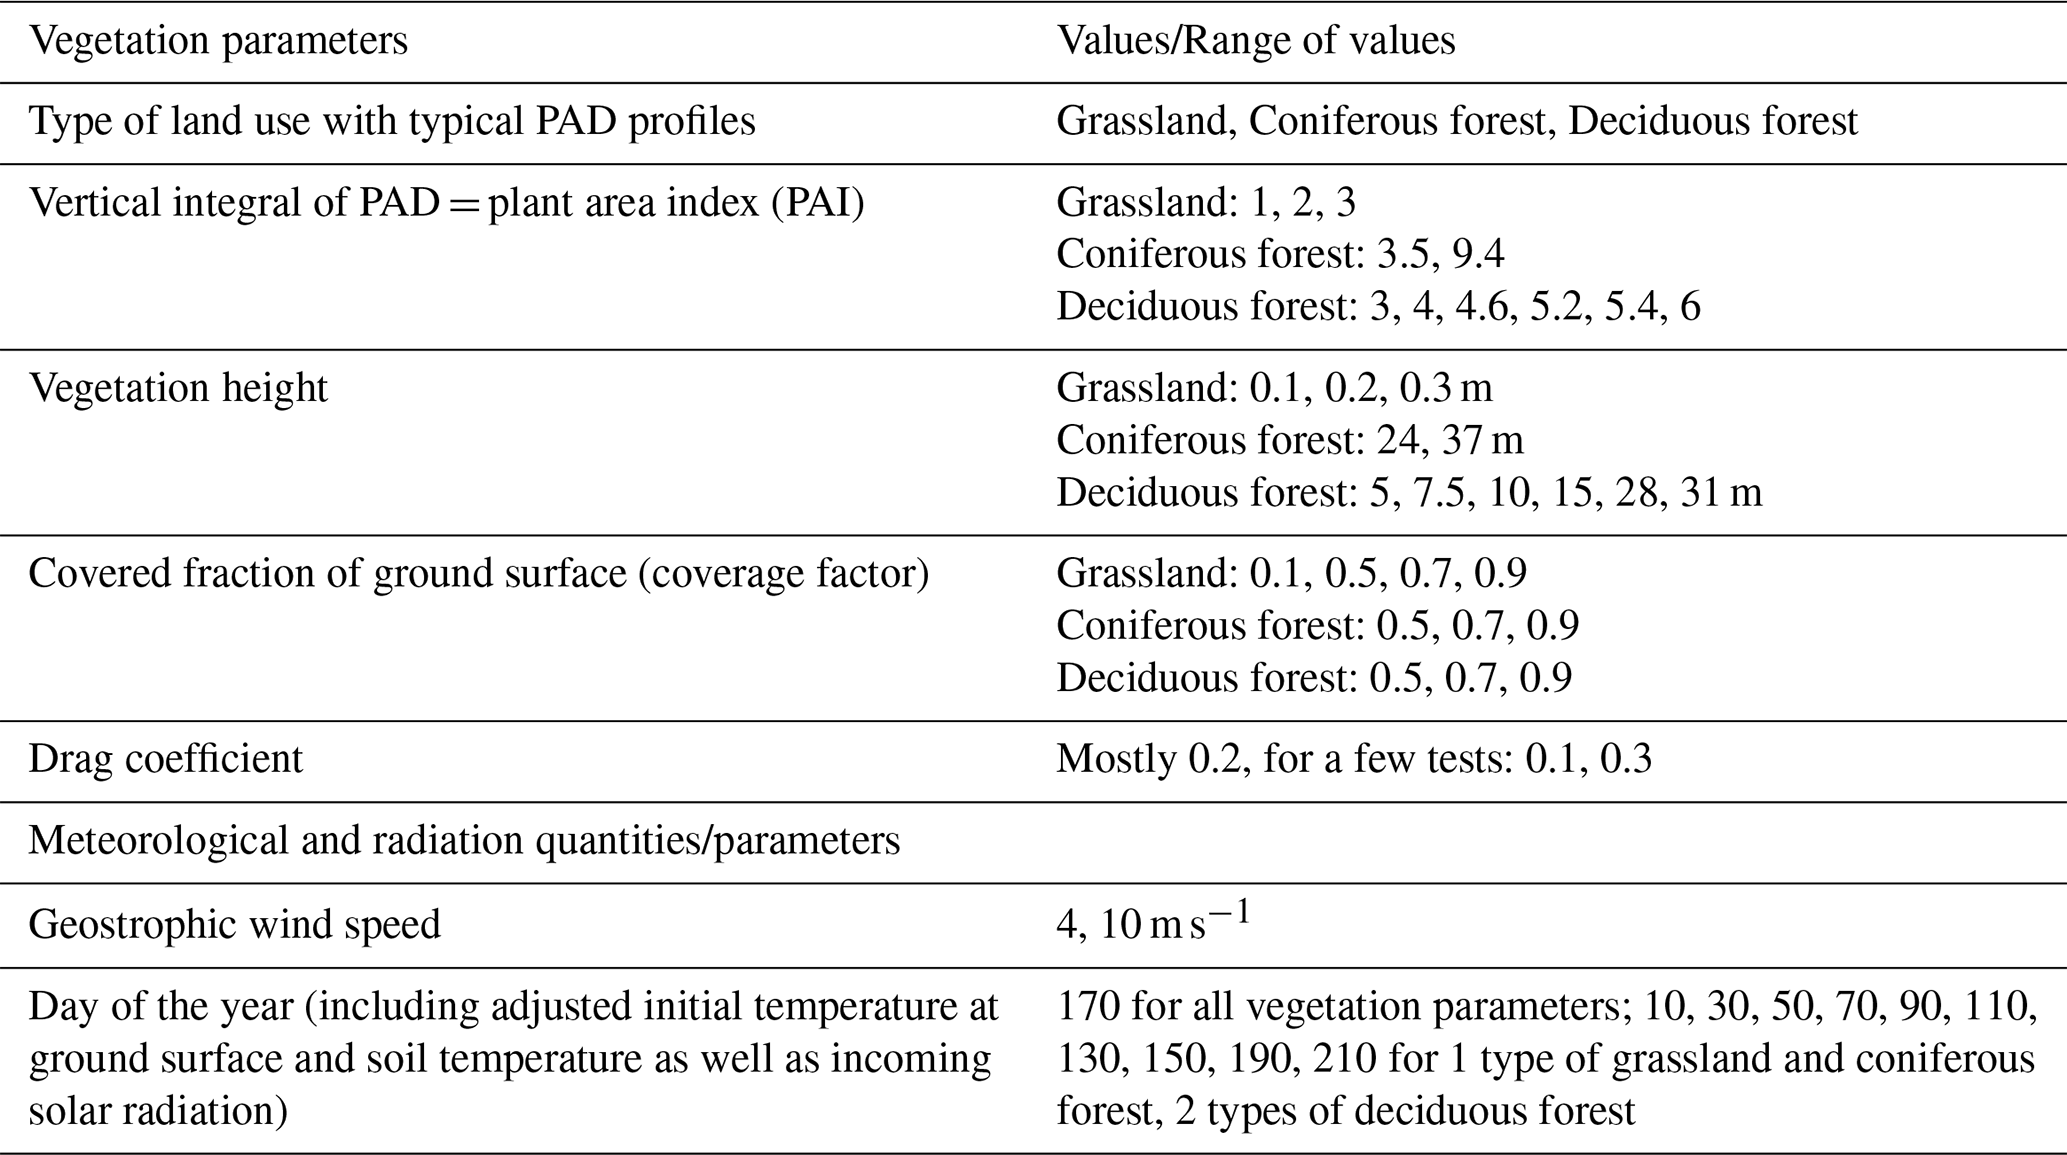

Figure 1Exemplary vertical profiles of plant area density used for model simulations with HIRVAC2D.
To transfer the results of the boundary layer model to specific sites in Germany, the regional climate model COSMO-CLM (CCLM; Rockel et al., 2008) was used, which is the climate version of the three-dimensional, non-hydrostatic mesoscale weather forecast model of the Germany's National Meteorological Service (Deutscher Wetterdienst). In the context of wind field studies, CCLM was already applied for highly resolved climatological investigations of the wind velocity in Germany (Walter et al., 2006). For the current study, statistically analyzed CCLM simulations of the wind field at a height of 850 hPa, i.e. the geostrophic wind velocity at the top of the ABL, for the land territory of Germany with a horizontal resolution of 2.8 km × 2.8 km are used.
A special feature of the numerical simulations is that changing conditions in present and future time are included for climate (forcing: reanalysis data from ERAinterim and scenario RCP 8.5 from EURO-CORDEX, resp.) and additionally for land use (data set from Hoymann and Goetzke, 2014). Model calculations are performed for two climate periods (history and evaluation run: 1981–2010, future run: 2021–2050). The comparative simulations for present time enable a consistent assessment of inherent model bias, which is considered for the analysis of future changes of wind field due to potentially anthropogenic activities. Thus, the numerical climate projections deliver a reliable basis for the estimation of future wind potential as well as the possible occurrence of LLJs depending on the frequency distribution of geostrophic wind speed. In Sect. 3.2, a selection of CCLM results for the present time scale is introduced for two grid points to demonstrate the influence of location properties on wind speed frequency distribution and wind rose.
3.1 Influences on properties of low-level jets
Nocturnal LLJs frequently develop when the near-surface turbulence decreases based on a stabilization of the air layer due to radiative cooling of the underlying surface (Emeis, 2014). The capability of HIRVAC2D to simulate such nocturnal LLJs is exemplarily shown in Fig. 2 for a relatively small geostrophic wind speed (vg) of 4 m s−1.
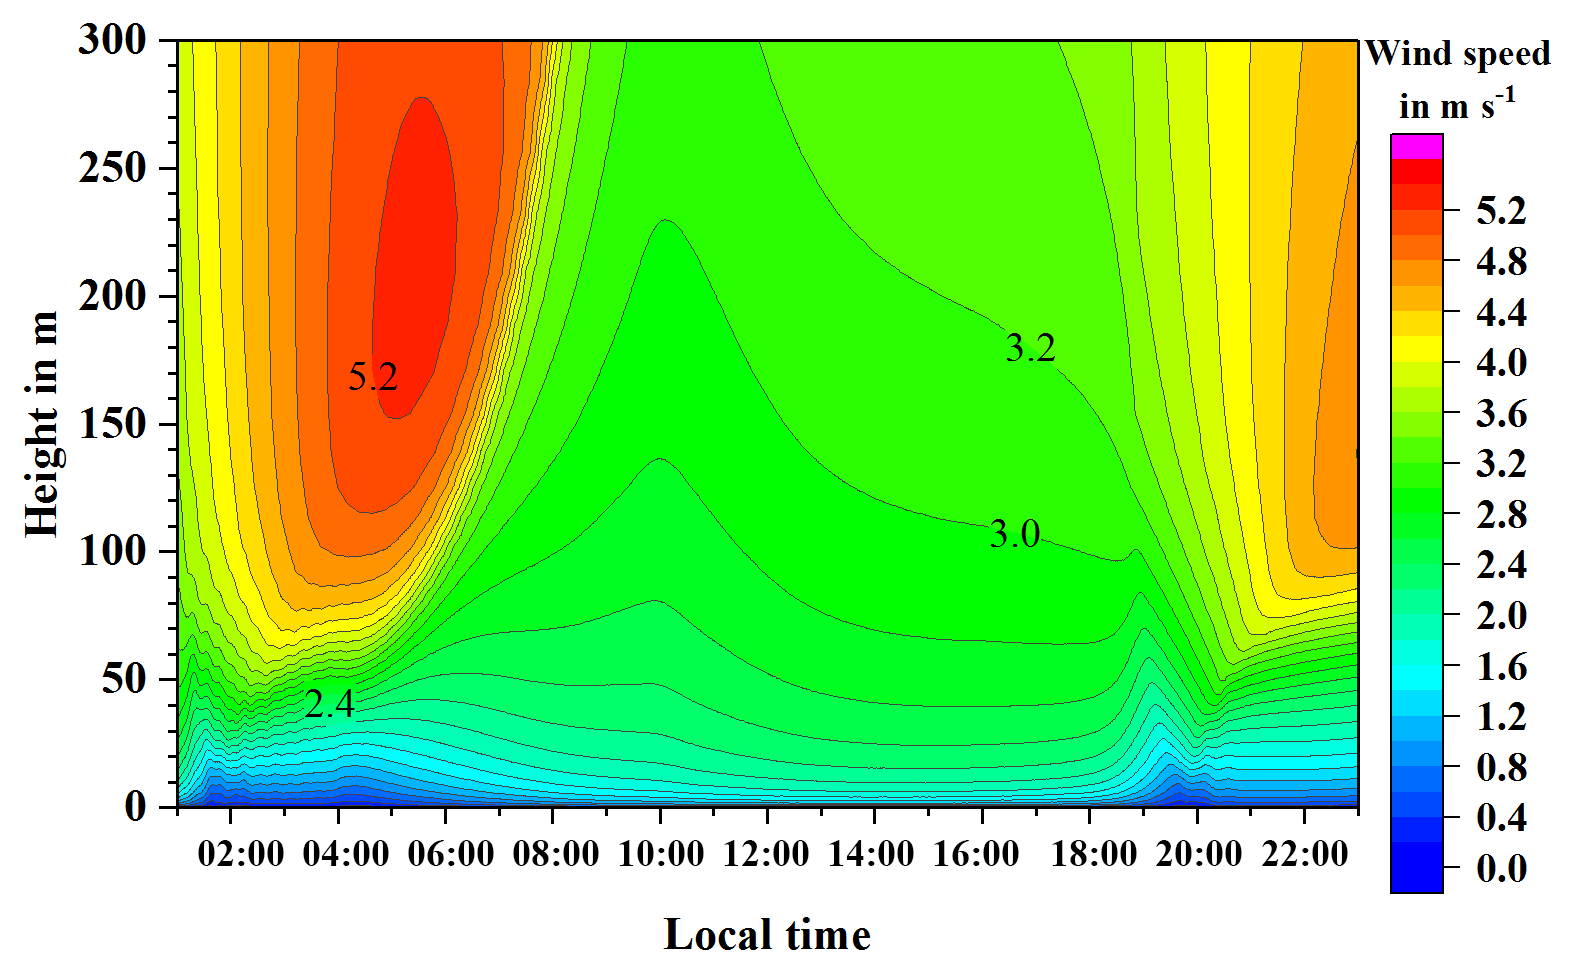
Figure 2Daily course of wind speed profiles simulated by HIRVAC2D for a cloudless summer day (19 June) over a homogeneous grassland site for vg=4 m s−1.
The maximum wind speed of the LLJ in Fig. 2 of about 5.2 m s−1 (i.e., 1.3 ⋅vg) develops about 6–7 h after sunset. Typical measured wind speed maxima between 4 and 9 m s−1 were located at a similar height of about 200 m for a flat grassland site (Braunschweig Airport, Lampert et al., 2016). This height range for LLJs is expected to be shifted to higher altitudes in the future due to global (and regional) warming (Gross, 2012). The simulated LLJ (Fig. 4) results in an approx. 60 % higher wind speed in comparison to that one calculated by the logarithmic wind profile. Consequently, the wind power is increased by a factor of approx. four. This simple example underlines the relevance of realistic wind field modelling for wind energy applications.
Hodographs (u- and v-component of horizontal wind vector) in Fig. 3 show the development of the LLJ event over a grassland site (Fig. 2) in time and height. The oscillating wind vector can be followed in its temporal rotation, which is maximum for the height of 200 m (jet maximum in the morning hours). The maximum wind speed considering the same height level is reached at first for the lowest height at 100 m and latest for 200 m (Fig. 3a). The vertical wind shear is maximum during the morning hours at 07:00 LT (Local Time) which can be detected from Fig. 3b.

Figure 3Hodographs (wind components u and v of the horizontal wind vector) simulated by HIRVAC2D for a cloudless summer day (19 June) at several times (a) between 01:00 and 10:00 LT (Local Time) and at several heights (b) over a homogeneous grassland site for vg=4 m s−1.
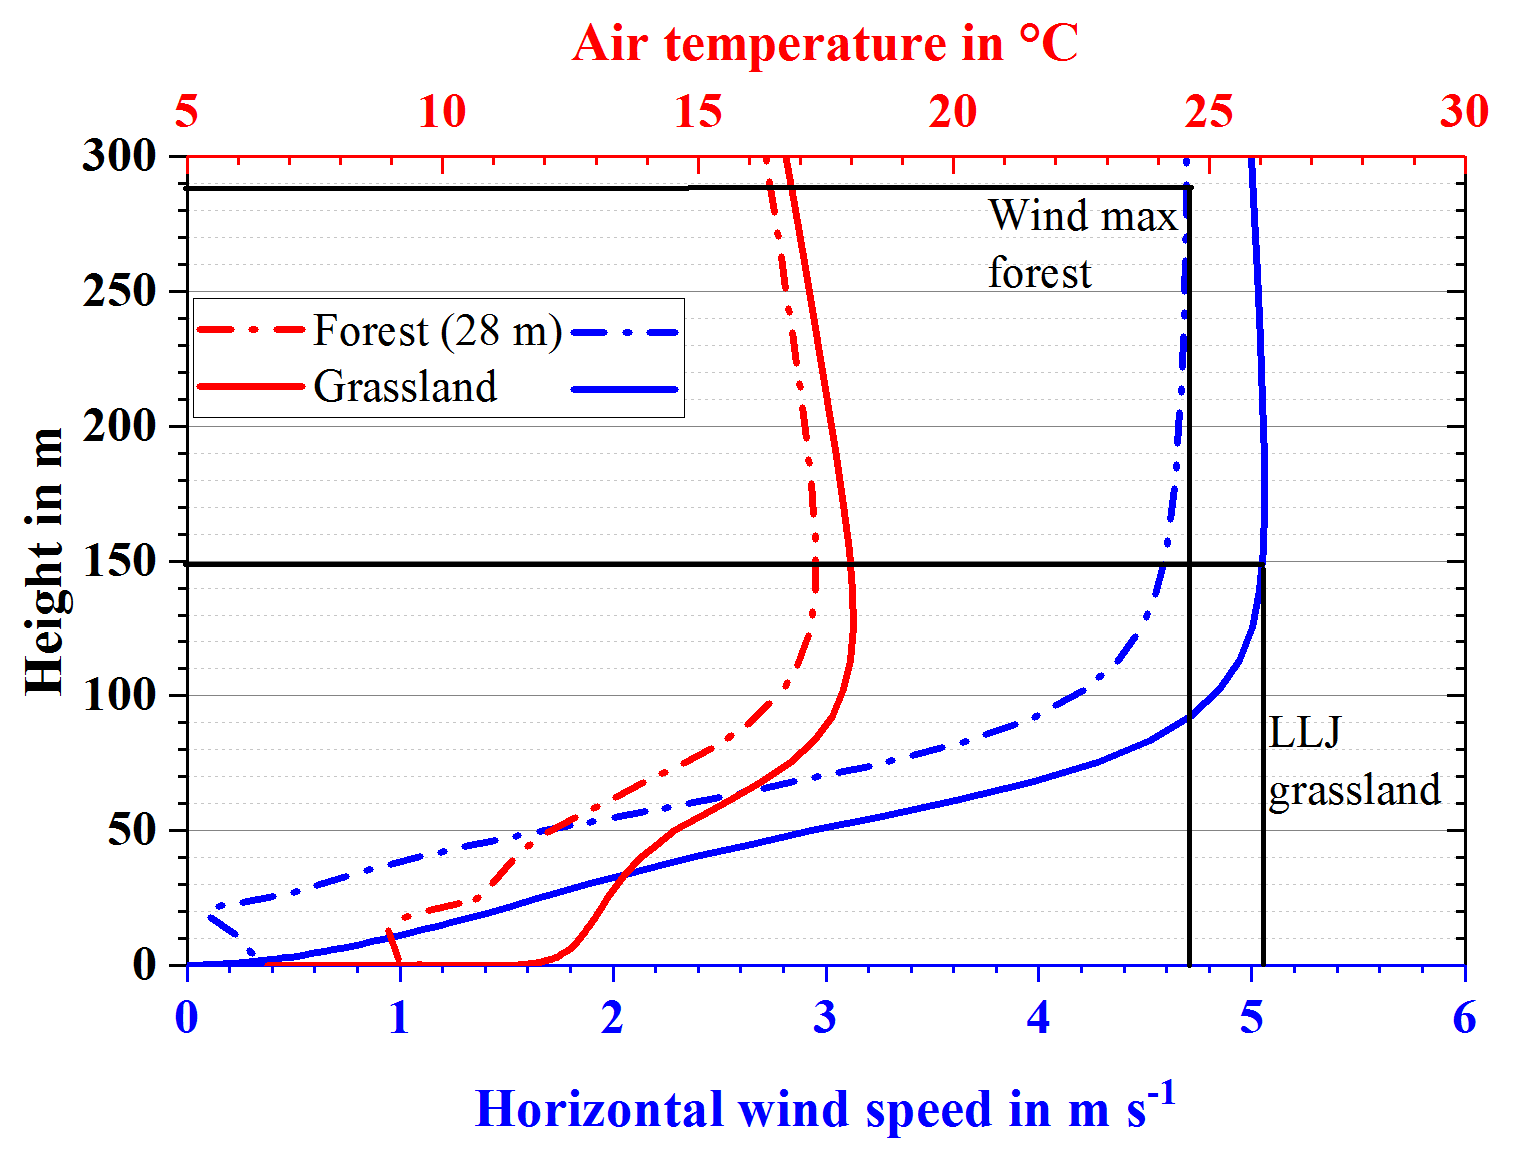
Figure 4Vertical profiles of wind speed (blue) and air temperature (red) above a grassland (solid line) and a deciduous forest site (dot-dashed line, PAD profile see Fig. 1) at 04:00 LT, cloudless summer day (19 June), vg=4 m s−1.
The properties of LLJs, like maximum wind speed and height of the jet core, depend on the kind of land use and the vegetation parameters. Figure 4 shows the comparison between the wind profiles over a grassland and a forest site. Above the ground-based inversion, which developed during a cloudless night, the typical wind speed maximum appears at 04:00 LT at a height of approx. 150 m for grassland and nearly at the doubled height for the forest site. Thus, the hub height of wind turbines within forests should be significantly increased in comparison to grassland sites to obtain comparable energy yields.
A LLJ was identified for a test case when the following conditions were met: difference between maximum vhmax and minimum vhmin (above the height of vhmax) wind speed ≥0.5 m s−1 and vhmax ∕ vhmin≥1.05. In 19 % (3 %) of the simulated test cases, a LLJ was detected for the smaller (higher) value of vg=4 m s−1 (vg=10 m s−1), i.e. the smaller (higher) pressure gradient, within the considered height range. Obviously, the formation of LLJs is suppressed by higher synoptic forcing. Emeis (2014) already stated this feature and found that most LLJs, measured by SODAR over two years, form for vg<14 m s−1. To assess the absolute number of detected LLJs it has to be noticed, that several LLJ definitions can be found in the literature (e.g., Gross, 2012; Lampert et al., 2016; Kalverla et al., 2019).
Figure 5 summarizes exemplary results of the numerous simulations for one value of vg (4 m s−1). Most LLJ events occur for grassland in comparison to a site with a higher degree of surface roughness, i.e. forest. The minimal number of LLJs within the shown height range was simulated using the PAD profile for a coniferous forest, characterized by a maximum plant area index PAI (vertical integral of PAD) and vegetation height. The dotted blue lines in Fig. 4 highlight the expected range of the maximum wind speed, which increases with increasing height due to the influence of LLJs over forests. If a LLJ forms above a forest area, then a higher maximum wind speed (1.25–1.4 ⋅vg) can be expected at one height in comparison to grassland (1.1–1.25 ⋅vg). In the context of rising hub heights of wind turbines, this result can be useful for the planning of onshore wind energy development.
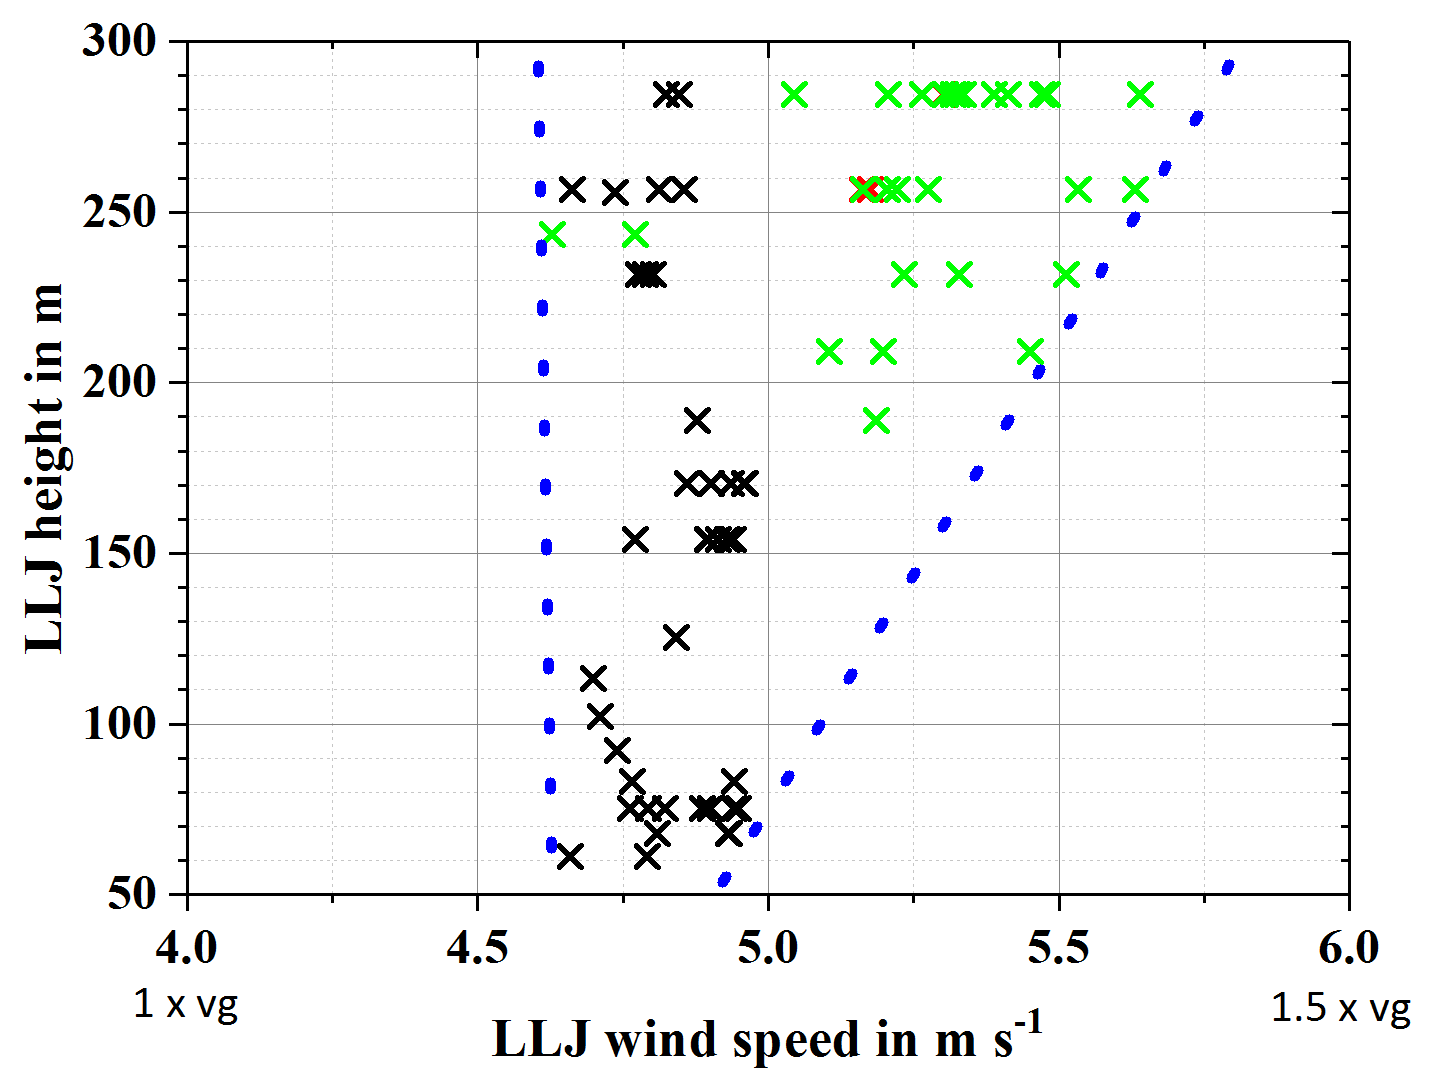
Figure 5Height and maximum wind speed of nocturnal LLJ events dependent on type of vegetation: grassland (black), deciduous (green) and coniferous (red) forest, for vg=4 m s−1. Dotted blue lines mark the range of LLJ wind speed values.

Figure 6Wind climatology (geostrophic wind speed at 850 hPa, 00:00 UTC) over 30 years (1981–2010) simulated by CCLM at two grid points: Friedland (picture above, co-ordinates: 52∘06′17′′ N, 14∘15′47′′ E, eastern Germany) and Philippsburg (picture below, co-ordinates: 49∘14′02′′ N, 8∘27′45′′ E, southwestern Germany); (a, c): frequency distribution, (b, d): wind rose for 12 sectors (wind direction: 0 = north, 90 = east, 180 = south, 270 = west, colors: wind speed in m s−1, circles: relative frequency in %).
In addition to the displayed analysis within a height range between 50 and 300 m and the two vg-values of 4 and 10 m s−1, the sensitivity study provided results for the occurrence of low-level jets over the full range of geostrophic wind speeds. These results are summarized as follows:
-
LLJ events occur mostly for clear nighttime situations over grassland sites, especially for 4 m s m s−1. The ratio between maximum wind speed to vg increases with decreasing vg.
-
The vegetation characteristics have an important influence for the occurrence of LLJs. Besides the height of the vegetation, the density is the significant factor. The smaller the coverage factor, the higher the probability of LLJ events and the higher is the maximum jet speed, respectively. Smaller values of vg enhance the development of LLJs over forest stands. For the coniferous forest with highest density (coverage factor 0.9, 37 m vegetation height, PAI =9.4) LLJs are formed up to geostrophic wind speeds of 6 m s−1 in comparison to several kinds of deciduous forests where LLJs occur for vg≤8 m s−1. Further vegetation parameters, like the drag coefficient, have a lower but also a detectable influence. As an example, a LLJ was detected for a 15 m high deciduous forest using a drag coefficient of 0.1 and 0.2, but not for 0.3.
-
The influence of changing seasons (solar radiation and initial temperature) was investigated for vg=4 m s−1 because LLJs occur for the most types of forests (for coniferous forests at least for heights above 300 m). LLJs over deciduous forests have the maximal intensity in winter and spring time up to beginning of summer. Over coniferous forest stands, LLJs can be found with maximal intensity in summer. The same result occurs for grassland, but additionally the intensity has a maximum in winter. Thereby, the initial temperature has the most important influence on the intensity of the LLJs. This clear dependency vanishes for higher geostrophic wind speeds (vg=10 m s−1).
3.2 Examples of frequency distribution of geostrophic wind speed in Germany
It was shown that the geostrophic wind speed is an important criterion for the development and the properties of LLJs. To assess the frequency of appropriate geostrophic wind speed conditions for the development of LLJs in Germany, statistically analysed COSMO-CLM simulations of wind velocity at 850 hPa were used for present and future time. A frequency distribution of vg over 30 years is exemplarily shown for two locations and for the period 1981–2010 (Fig. 6). The chosen locations are potentially suitable for wind energy applications regarding requirements of nature conservation and distance to settlements. Figure 6 illustrates the influences of topography, regional and local circulation pattern and the frequency of weather conditions for the resulting distribution of wind speed and direction.
Westerly wind directions characterize the location in eastern Germany (Friedland) and additionally southeast directions especially during the winter season. The wind rose is typical for the west wind zone of North German Plain in the transition region between oceanic and continental climate of Western and Eastern Europe, respectively.
In comparison to that, the location in southwestern Germany (Philippsburg) in the Upper Rhine Plain is characterized by its special topography and the southwest-to-northeast orientation of the Rhine Valley. The canalization of southwest winds is followed by a high frequency of this wind direction together with higher wind speeds for this sector. Additionally, the frequent southwest weather conditions lead to a mild climate with relatively high mean temperature values.
Most frequent wind speed values occur for Philippsburg (33 %) between 4 and 8 m s−1 and for Friedland (31 %) between 6 and 10 m s−1 that means within a range of suitable vg values for developing of LLJs regarding the HIRVAC2D sensitivity study.
To quantitatively describe the dependencies of wind phenomena at hub heights of modern wind turbines, the meso-scale model CCLM and the micro-scale model HIRVAC2D were applied.
The properties of nocturnal low-level jets (LLJs), frequently observed local wind maxima in the stably stratified boundary layer, were studied using the ABL model HIRVAC2D. An important meteorological factor is the geostrophic wind speed at the top of the boundary layer, i.e. the synoptic forcing. In general, the smaller the geostrophic wind speed (here: vg=4 m s−1 in comparison to vg=10 m s−1), the higher is the probability for the development of LLJs. Simulation results from the regional climate model CCLM were applied to estimate suitable conditions for the formation of nocturnal LLJs in Germany. The frequency distribution of geostrophic wind speed at two exemplary locations shows frequently adequate wind conditions that can initiate the development of LLJs during cloudless night-time hours regarding the results of the HIRVAC2D sensitivity study.
An additional factor for occurrence, height and wind speed is the kind of land use. Most LLJ events occur for grassland in comparison to a forested site. For a geostrophic wind speed of 10 m s−1, there is no nocturnal LLJ event for any kind of forests within the studied height range (50–300 m). Applying vg=4 m s−1, the minimal number of LLJs was simulated for a coniferous forest, characterized by a maximum plant area index and vegetation height. If a LLJ forms above a forest, then a higher maximum wind speed (1.25–1.4 ⋅vg) can be expected at one height in comparison to grassland (1.1–1.25 ⋅vg).
As a next step to transfer model results to practical applications for wind energy there is a need for adjusted validation of the model results to quantify the accuracy of the model at representing the real world, i.e. measurement results. There is actually no model evaluation of HIRVAC2D with observational data for heights above 50 m. A special observational period took place in 2016 at the micro-meteorological test site Tharandt forest using a SODAR and a captive balloon. A first comparison between selected measurement data and adjusted model simulations will be prepared for a publication soon.
It would be desirable to include LLJ events in standardized models for wake and load simulations. The presented model HIRVAC2D could be used, after a model comparison with wind measurements at heights above 50 m, to parameterize realistic inflow fields for wind farm simulations. Since the presence of different land use types turns out to have a remarkable effect on the occurrence and properties of LLJs, it would be also interesting to investigate the influence of heterogeneous vegetation (change of forests and grasslands) on LLJs with future HIRVAC2D simulations. The largest implications of LLJ modelling are seen for wind resource assessments. Additionally, applications for short-term wind energy predictions could be possible, e.g. for downscaling of meso-scale output of numerical weather prediction models.
Furthermore, the presented model chain of HIRVAC2D and CCLM is applied to generate a high-resolution wind climatology for Germany within the project QuWind100. Basis of the project is a comprehensive modelling of the wind field depending on the season and daytime as well as the land use with high horizontal resolution (100 m) for Germany. The inclusion of the projection of future changes in land use permits the quantification of future wind potentials by 2050. Influences of LLJs in time and space are inherent part of the raster-based wind database, which will be published in the near future.
Data are available upon request by the corresponding author at present. The data sets will be freely available after finishing all analyses within the QuWind100 project. Please follow the updates on the project web sites for access information: https://tu-dresden.de/bu/umwelt/hydro/ihm/meteorologie/forschung/forschungsprojekte/quwind100/index (last access: 25 May 2019).
AZ and MS are responsible for the ABL model HIRVAC2D and TL for the climate model CCLM. The HIRVAC2D simulations and the detection of LLJs in the data were provided by MS. The analysis and discussion of the LLJ data were performed by AZ. TL provided the CCLM simulations. AZ prepared the manuscript with contributions from all co-authors.
The authors declare that they have no conflict of interest.
This article is part of the special issue “18th EMS Annual Meeting: European Conference for Applied Meteorology and Climatology 2018”. It is a result of the EMS Annual Meeting: European Conference for Applied Meteorology and Climatology 2018, Budapest, Hungary, 3–7 September 2018.
This research has been supported by the German Federal Ministry for Economic Affairs and Energy (grant no. 0325940).
This paper was edited by Sven-Erik Gryning and reviewed by two anonymous referees.
Baas, P., Bosveld, F. C., Klein Baltink, H., and Holtslag, A. A. M.: A climatology of nocturnal low-level jets at Cabauw, J. Appl. Meteorol. Clim., 48, 1627–1642, https://doi.org/10.1175/2009JAMC1965.1, 2009.
Blackadar, A. K.: Boundary layer wind maxima and their significance for the growth of nocturnal inversions, B. Am. Meteorol. Soc., 38, 283–290, 1957.
Deutsche WindGuard: Status des Windenergieausbaus an Land in Deutschland, available at: https://www.wind-energie.de/fileadmin/redaktion/dokumente/publikationen-oeffentlich/themen/06-zahlen-und-fakten/20180125_factsheet_status_windenergieausbau_an_land_2017.pdf, last access: 15 January 2019, 2017.
Emeis, S.: Wind speed and shear associated with low-level jets over Northern Germany, Meteorol. Z, 23, 295–304, https://doi.org/10.1127/0941-2948/2014/0551, 2014.
Falge, E., Reth, S., Brüggemann, N., Butterbach-Bahl, K., Goldberg, V., Oltchev, A., Schaaf, S., Spindler, G., Stiller, B., Queck, R., Köstner, B., and Bernhofer, C.: Comparison of surface energy exchange models with eddy flux data in forest and grassland ecosystems of Germany, Ecol. Model., 188, 174–216, https://doi.org/10.1016/j.ecolmodel.2005.01.057, 2005.
Fischer, B., Goldberg, V., and Bernhofer, C.: Effect of a coupled soil water–plant gas exchange on forest energy fluxes: Simulations with the coupled vegetation–boundary layer model HIRVAC, Ecol. Model., 214, 75–82, https://doi.org/10.1016/j.ecolmodel.2008.02.037, 2008.
Gross, G.: Numerical simulation of future low-level jet characteristics, Meteorol. Z., 21, 305–311, https://doi.org/10.1127/0941-2948/2012/0279, 2012.
Gutierrez, W., Araya, G., Kiliyanpilakkil, P., Ruiz-Columbie, A., Tutkun, M., and Castillo, L.: Structural impact assessment of low level jets over wind turbines, J. Renew. Sust. Ener., 8, 023308, https://doi.org/10.1063/1.4945359, 2016.
Hoymann, J. and Goetzke, R.: Die Zukunft der Landnutzung in Deutschland–Darstellung eines methodischen Frameworks, Raumforsch. Raumordn., 72, 211–225, https://doi.org/10.1007/s13147-014-0290-y, 2014.
Ivanell, S., Arnqvist, J., Avila, M., Cavar, D., Chavez-Arroyo, R. A., Olivares-Espinosa, H., Peralta, C., Adib, J., and Witha, B.: Micro-Scale Model Comparison (Benchmark) at the Moderately Complex Forested Site Ryningsnäs, Wind Energy Science, 3, 929–946, https://doi.org/10.5194/wes-3-929-2018, 2018.
Kalverla, P. C., Duncan Jr., J. B., Steeneveld, G.-J., and Holtslag, A. A. M.: Low-Level Jets over the North Sea Based on ERA5 and Observations: Together They Do Better, Wind Energy Science, 4, 193–209, https://doi.org/10.5194/wes-4-193-2019, 2019.
Kottmeier, C., Lege, D., and Roth, R.: Ein Beitrag zur Klimatologie und Synoptik der Grenzschicht-Strahlströme über der norddeutschen Tiefebene, Ann. Meteorol. N. F., 20, 18–19, 1983.
Lampert, A., Bernalte Jimenez, B., Gross, G., Wulff, D., and Kenull, T.: One-year observations of the wind distribution and low-level jet occurrence at Braunschweig, North German Plain, Wind Energy, 19, 1807–17, https://doi.org/10.1002/we.1951, 2016.
Lettau, H.: Graphs and illustrations of diverse atmospheric states and processes observed during the seventh test period of the Great Plains turbulence field program, Occasional Report 1, Atmospheric Analysis Laboratory, Air Force Cambridge Research Center, Bedford, Massachusetts, 1954.
Mix, W., Goldberg, V., and Bernhardt, K.-H.: Numerical experiments with different approaches under large-area forest canopy conditions, Meteorol. Z., 3, 187–192, 1994.
Queck, R., Bernhofer, C., Bienert, A., Eipper, T., Goldberg, V., Harmansa, S., Hildebrand, V., Maas, H. G., Schlegel, F., and Stiller, J.: TurbEFA: an interdisciplinary effort to investigate the turbulent flow across a forest clearing, Meteorol. Z., 6, 637–659, https://doi.org/10.1127/metz/2014/0567, 2015.
Rockel, B., Will, A., and Hense, A.: The regional climate model COSMO-CLM (CCLM), Meteorol. Z., 17, 347–348, https://doi.org/10.1127/0941-2948/2008/0309, 2008.
Sanz Rodrigo, J., Churchfield, M., and Kosovic, B.: A methodology for the design and testing of atmospheric boundary layer models for wind energy applications, Wind Energy Science, 2, 35–54, https://doi.org/10.5194/wes-2-35-2017, 2017.
Storm, B., Dudhia, J., Basu, S., Swift, A., and Giammanco, I.: Evaluation of the Weather Research and Forecasting model on forecasting low-level jets: implications for wind energy, Wind Energy, 12, 81–90, https://doi.org/10.1002/we.288, 2009.
Stull, R.: An Introduction to Boundary-Layer Meteorology, Kluwer Academic Publishers, Dordrecht, 666 pp., 1988.
Walter, A., Keuler, K., Jacob, D., Knoche, R., Block, A., Kotlarski, S., Müller-Westermeier, G., Rechid, D., and Ahrens, W.: A high resolution reference data set of German wind velocity 1951–2001 and comparison with regional climate model results, Meteorol. Z., 15, 585–596, https://doi.org/10.1127/0941-2948/2006/0162, 2006.
Wilczak, J., Finley, C., Freedman, J., Cline, J., Bianco, L., Olson, J., and Djalalova, I.: The wind forecast improvement project (WFIP): A public–private partnership addressing wind energy forecast needs, B. Am. Meteorol. Soc., 96, 1699–1718, https://doi.org/10.1175/BAMS-D-14-00107.1, 2014.
Ziemann, A.: Numerical simulation of meteorological quantities in and above forest canopies, Meteorol. Z., 7, 120–128, 1998.