Articles | Volume 16
https://doi.org/10.5194/asr-16-69-2019
27 May 2019
 | 27 May 2019

Statistical analysis of very high-resolution precipitation data and relation to atmospheric circulation in Central Germany

Annika Brieber and Andreas Hoy
Abstract

The cumulative occurrence of heavy precipitation and flood events during recent years in various Central European locations emphasises the urgent need to improve extreme rainfall observations and forecasts. Precipitation gauges based on a weighing system allow the recording of intense short-term precipitation events with a very high temporal resolution (down to 1 min). In this study, observational data that were collected during the period 2000 to 2016 for 126 stations of two corresponding measuring networks in the Central German state of Hesse were investigated for the first time to answer the following questions: (1) Are the recorded high-resolution precipitation data plausible and comparable between both networks? (2) Which atmospheric circulation patterns were specifically prone to produce short-term intense precipitation events?

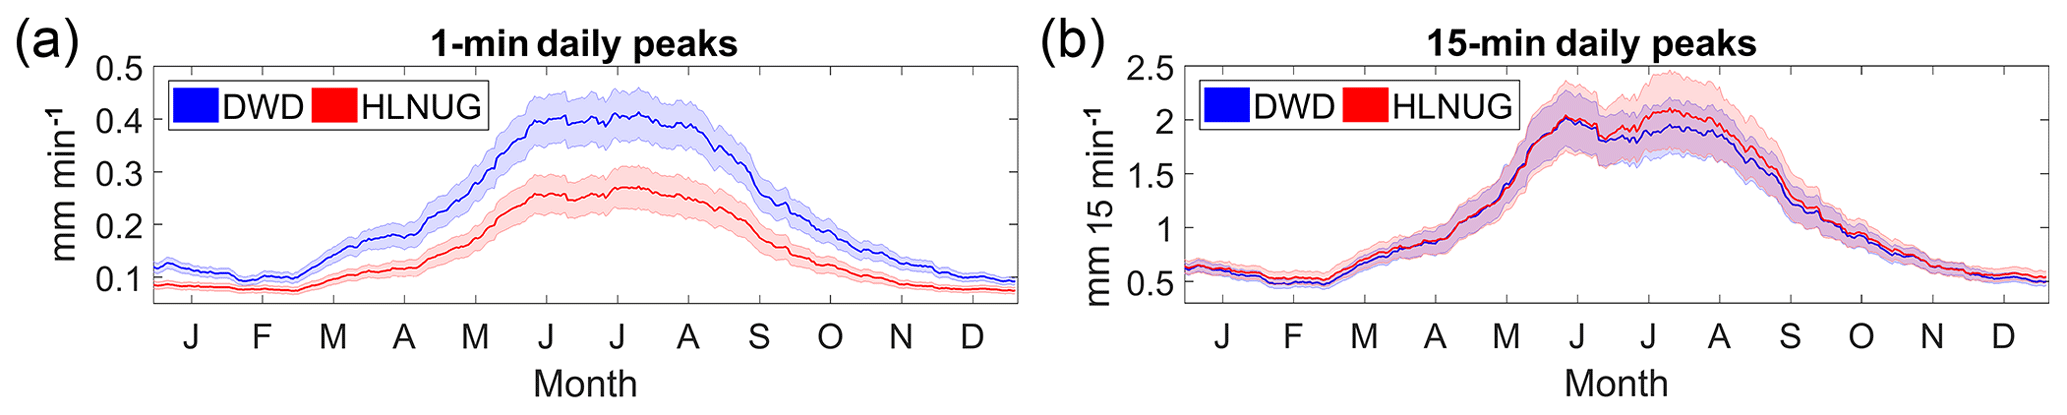
Although the two networks are equipped with the same measuring technology, systematic differences concerning their maximum 1 min precipitation amounts occur, which may be explained by different instrumental software settings. We could minimise those discrepancies by accumulating the existing 1 min data to 15 min.

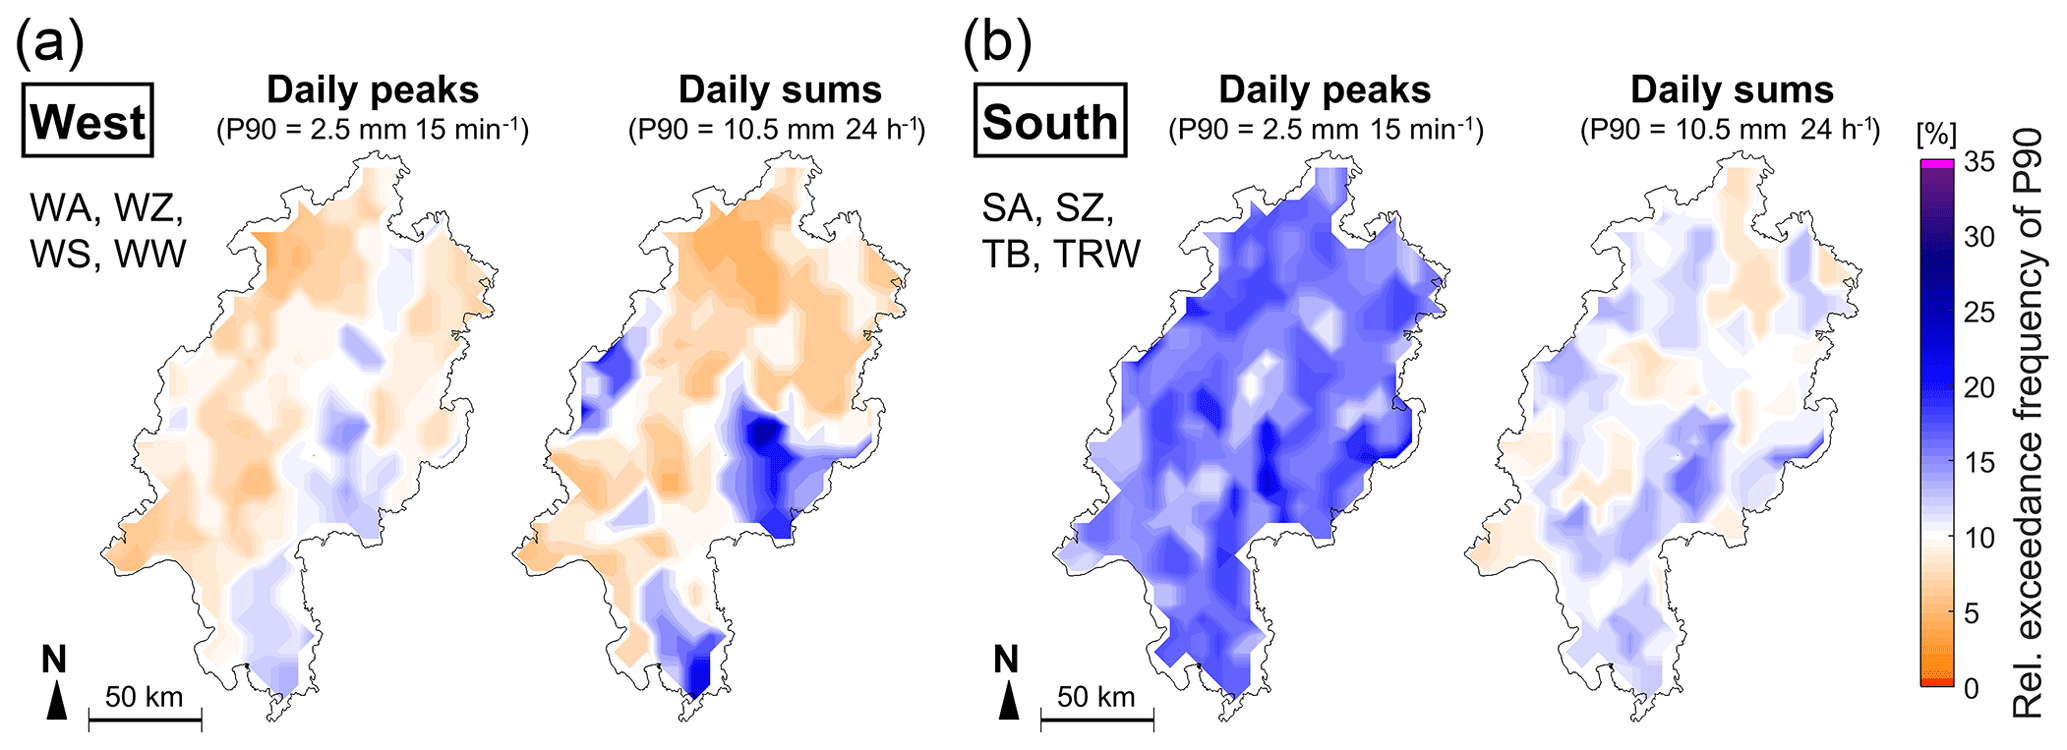
Subsequently, the 15 min daily maximum values and accumulated daily sums were analysed regarding the impact of large-scale atmospheric circulation patterns, based on the well-known “Großwetterlagen” classification. We identified a clear connection between atmospheric circulation and heavy precipitation over Hesse, while indicating some differences between daily (24 h) and sub-daily (15 min) events. High daily precipitation sums often relate to westerlies and central cyclones, while intense short-term events are frequently generated by warm-humid continental air from southern and eastern Europe as well as trough conditions, where the trough's core is found west of the study area. Our results underline the importance of expanding and enhancing high-resolution precipitation observations in Germany as well as other countries.

Dates
1 Introduction

Hardly any other meteorological parameter has such a high spatial and temporal variability as precipitation. Forecasts and trend analyses regarding its distribution and intensity accordingly produce diverse and sometimes even contradictory results (Zolina et al., 2008; Malitz et al., 2011; Becker et al., 2016; Junghänel and Deutschländer, 2017). At the same time, there is a rising public and political interest in understanding the processes leading to heavy precipitation due to its disaster potential. High-intensity rainfall events that overstress urban drainage systems often last for only a few hours or even minutes (de Toffol et al., 2003). In Germany, there is a lack of corresponding long-term observational data and evaluations in high temporal resolution so far, since the official German meteorological monitoring network was originally designed to measure daily sums. The study of Müller and Pfister (2011), using long time series of high-resolution precipitation observations, is one of the rare exceptions.

Only since the 1990s more and more measuring stations in Germany have been equipped with PLUVIO-OTT precipitation gauges. In contrast to conventional precipitation collectors used within Germany (e.g., the “Hellmann” collector), those instruments are based on a weighing principle, i.e., the precipitation amount in the storage bin is derived from its mass. The fully automated gauges record precipitation sums with a temporal resolution of 1 min. Although the length of the corresponding time series is not yet sufficient for climatological trend analyses, the station densities of two datasets within the German state of Hesse are now extensive enough to derive statistically reliable statements about data homogeneity between the two networks and the spatial distribution of high-intensity precipitation in the region.

The first part of this study focuses on data quality control (Sect. 3), the second on the relation between intense precipitation and atmospheric circulation (Sect. 4). This approach is based on the assumption that large-scale airflow patterns can directly influence local weather phenomena (Barnston and Livezey, 1987) and that abundant precipitation occurs more frequently during certain states of the atmospheric circulation than during others (Hoy et al., 2013). The best-known example of this connection is the “Vb-Wetterlage”, attracting warm and wet air masses from the Mediterranean, with its high rainstorm and flood potential in Central-Eastern Europe (Mudelsee et al., 2004). Here, we aim to identify atmospheric circulation patterns that are associated with a particularly high risk of intense precipitation in Central Germany and to identify potential differences between short-term (15 min) and long-term (24 h) events.

2 Data and methods

The study was conducted within the scope of the Hessian KLIMPRAX projects, which deal with local and regional impacts of anthropogenic climate change (HLNUG, 2018). The PLUVIO-OTT datasets of 47 stations of the regional water authority of Hesse (HLNUG) and 79 stations of the German Weather Service (DWD) were combined for the first time and analysed for the period 2000 to 2016.

https://www.adv-sci-res.net/16/69/2019/asr-16-69-2019-f01

Figure 1Map of Europe, showing the study area of Hesse, a state in Germany, its topography (altitude in meters above sea level) and the spatial distribution of all 126 measuring stations within this study.

Download

https://www.adv-sci-res.net/16/69/2019/asr-16-69-2019-f02

Figure 2Mean seasonal cycle of daily maximum values; 1 min peaks (a) and 15 min peaks (b), averaged over all years (2000 to 2016) and all stations (DWD: blue, HLNUG: red); moving averages (30 d) and 95 % confidence intervals (shaded).

Download

First, all precipitation days with a daily sum of 0.1 mm or more were extracted from the measuring period. In addition to the accumulated 24 h sum, the daily maximum was determined for every precipitation day at every station (e.g., the highest 1 min sum and the highest 15 min sum that occurred on that day). In order to compare the average climatologies of daily maxima, DWD und HLNUG data were examined separately (Fig. 2). Subsequently, all individual station values were merged together, resulting in a dataset of 245 427 precipitation days (117 680 of them during the summer half year). Based on this overall distribution, percentile-based threshold values – namely the 90th, 95th and 99th percentile – were calculated in terms of both daily sums and daily 15 min maxima.

https://www.adv-sci-res.net/16/69/2019/asr-16-69-2019-f03

Figure 3Percentage of high-intensity precipitation classes (> 90th/95th/99th percentile = P90/P95/P99) in relation to the total number of precipitation days (summed up over all stations and the whole measuring period 2000–2016) for daily 15 min peak values (above) and daily sums (below) during the summer half year (April to September), sorted according to different circulation patterns (GWL).

Download

In the next step, the data was sorted according to the large-scale state of the atmosphere that prevailed on the respective precipitation days. We employed atmospheric circulation patterns categorised according to Werner and Gerstengabe (2010), who distinguish between 29 different “Großwetterlagen” (GWL; see Fig. 3). Every precipitation day recorded at every station used in this study was allocated to one of those GWL in order to identify GWL prone to heavy precipitation.

https://www.adv-sci-res.net/16/69/2019/asr-16-69-2019-f04

Figure 4Relative exceedance frequency of the 90th percentile (P90) of daily 15 min peak values (left) and daily sums (right) for different air mass inflow directions: West (a), covering the GWL subtypes WA, WZ, WS and WW, and South (b), covering the GWL subtypes SA, SZ, TB and TRW; spatial distribution with nearest-neighbour interpolation.

Download

The exceptionally high number and good spatial distribution of available stations (Fig. 1) allowed to produce maps by interpolation using the nearest-neighbour method. After cartographical visualisation (Fig. 4), statements about the topography's impact on precipitation distribution could be derived.

3 Data quality and comparability between the two datasets

The first part of the study aims to clarify whether the PLUVIO-OTT weighting technology, applied by two different measuring networks, provides plausible values that can be combined to one homogeneous dataset. In this context, the comparability of extreme values is of particular interest as this study focuses on intense precipitation events characterised by high precipitation sums within a short time period. Therefore, the average climatology of daily maxima (1 min) was calculated separately for HLNUG and DWD stations to be able to compare them with each other (Fig. 2a).

Both annual cycles show a reasonable maximum in summer due to the increased occurrence of convective rainfall at higher temperatures. However, large deviations between HLNUG and DWD data become apparent especially during the summer months. On average the DWD dataset contains significantly higher peaks than the HLNUG dataset.

This divergence cannot solely be explained by location factors, but must have further, technical causes. Most likely the software settings used by DWD and HLNUG are not exactly the same: Depending on these settings, the instrument automatically smoothens the recorded data (e.g., by averaging over several minutes). This method shall prevent measurement errors caused, e.g., by artificial irrigation or animals, but at the same time true precipitation peaks may be underestimated. In exchange with DWD staff, software-controlled smoothing during data logging turned out to be the most likely explanation why the HLNUG dataset contains significantly fewer/lower peak values than the DWD dataset (Thomas Deutschländer and Thomas Junghänel, personal communication, 2017). In order to be able to combine the two datasets, they are both aligned with each other by adding up the 1 min data to precipitation sums over several minutes. It turned out that beyond a duration level of 15 min the difference between the datasets gets negligibly small (Fig. 2b), which is why 15 min sums are used for all further calculations.

4 Connection between heavy precipitation and atmospheric circulation

In the second part of the study, the influence of atmospheric circulation on heavy precipitation and threshold exceedances in Hesse is investigated. Figure 3 shows the percentage of three threshold exceedance classes (> 90th/95th/99th percentile) in relation to the total number of precipitation days (≥ 0.1 mm) allocated to different atmospheric circulation patterns (GWL) during the summer half year. If there is an above-average percentage of threshold exceedance during a certain state of the atmospheric circulation, the corresponding GWL is assumed to have an enhancing impact on summer precipitation intensity, either concerning short-term peaks (Fig. 3, above) or daily sums (Fig. 3, below).

For example, the percentage of heavy daily precipitation is particularly high during summerly TM days, when low pressure systems stagnate over Central Europe (Fig. 3, below). Also, warm air mass inflow from southern and eastern directions has a strong positive effect on precipitation intensity, especially concerning the short-term peaks (Fig. 3, above).

The resilience of the results for each GWL can be estimated by considering the total number of precipitation days listed in Fig. 3: For example, the rare occurrence of summer precipitation during some meridional circulation patterns (such as SEA or SA) led to a very sparse data basis – the corresponding results are therefore less significant than the results of GWL connected to a high amount of precipitation days (such as WZ, TRM, TRW).

As the total quantity of all stations is considered in Fig. 3, a high proportion of threshold exceedances could mean that high values were measured very frequently at certain stations and/or at many stations simultaneously. To get an impression of the spatial distribution, the exceedance frequency of the 90th percentile is interpolated over the whole study area in Fig. 4 (be aware that in contrast to Fig. 3 data of the whole year and not just the summer months are considered here). The maps reveal that maritime moisture advected by westerlies is released particularly at the mountain slopes, thus there is a strong correlation between intense daily precipitation and Hessian topography during westerly air mass inflow (Fig. 4a, right). On the contrary, southern air mass inflow leads to rather randomly distributed convective events that are much less affected by topography – they appear on the map of 15 min peaks (Fig. 4b, left).

Finally, it is noteworthy that trough conditions over Central Europe (TRM, often associated with the “Vb-Wetterlage”) are not very relevant for heavy summer precipitation in the study area (Fig. 3). Instead, there is a much higher probability of extreme daily and sub-daily precipitation sums if the trough's core is found over Western Europe (TRW, Fig. 3).

5 Conclusions

This study made a first attempt to analyse precipitation data that were recorded by 126 PLUVIO-OTT gauges in Hesse in Central Germany over a period of 17 years (2000–2016). It became clear that a new measurement technology can be sensitive to unforeseen sources of error like divergences in software calibration. This is why a regular evaluation of the recorded measurement series is absolutely necessary in order to detect and correct such errors already at an early stage. It is very likely that the data inhomogeneities encountered in this study are not restricted to the Hessian measuring networks, but that the analysis of high resolution precipitation data in other regions of Germany and Europe will face similar challenges.

In a next step, it would be interesting to check the spatial distribution of threshold value exceedances for plausibility by comparing the here presented maps with results from radar mapping in the RADOLAN project: Within the scope of that project, Winterrath et al. (2017) generated a precipitation climatology for the whole of Germany based on continuous radar data covering the period 2001 to 2016.

Our results show that intense daily (24 h) and sub-daily events (15 min) clearly differ from each other with regard to their spatial occurrence as well as to the main triggering GWL patterns. On a daily level, we could confirm that air masses approaching from western directions lead to high daily precipitation amounts which generally increase with altitude. The highest probability of abundant daily precipitation connects to low pressure systems stagnating centrally over Germany. Intense short-term (15 min) rainfall events over Hesse are more likely with the inflow of warm continental air from southern and eastern Europe during the summer half year, caused by spatially rather randomly distributed convective events. Trough conditions enhance the number of intense short-term precipitation events as well, but only if the trough's core is found west of the study area.

Finally, our study justifies the ongoing efforts to expand and enhance the short-duration precipitation observation network. In combination with further investigations on the subject of atmospheric circulation and heavy precipitation events, the results of this study contribute to the development of reliable time series of high resolution precipitation data. This enables future trend analyses and creates the basis for regional adaptation strategies and disaster prevention.

Data availability

The high-resolution precipitation data of the German Weather Service can be accessed via the DWD Climate Data Center (https://cdc.dwd.de/portal/, last access: 23 May 2019). The HLNUG data are not freely accessible in one-minute resolution as used in this paper, but can be purchased from the HLNUG on request.

Author contributions

AB was responsible for data evaluation, creation of figures and interpretation of results, while AH scientifically supported those acitivities. Both authors conducted the manuscript in its published form.

Competing interests

The authors declare that they have no conflict of interest.

Special issue statement

This article is part of the special issue “18th EMS Annual Meeting: European Conference for Applied Meteorology and Climatology 2018”. It is a result of the EMS Annual Meeting: European Conference for Applied Meteorology and Climatology 2018, Budapest, Hungary, 3–7 September 2018.

Acknowledgements

We are grateful to DWD and HLNUG for providing the high-resolution precipitation data required for this study. We also thank the editor and reviewers for their comments, which helped further improving this manuscript.

Financial support

This open-access publication was funded
by Johannes Gutenberg University Mainz.

Review statement

This paper was edited by Rasmus Benestad and reviewed by Eirik Forland and one anonymous referee.

References

Barnston, A. G. and Livezey, R. E.: Classification, Seasonality and Persistence of Low-Frequency Atmospheric Circulation Patterns, Mon. Weather Rev., 115, 1083–1126, https://doi.org/10.1175/1520-0493(1987)115<1083:CSAPOL>2.0.CO;2, 1987. 

Becker, P., Becker, A., Dalelane, C., Deutschländer, T., Junghänel, T., and Walter, A.: Die Entwicklung von Starkniederschlägen in Deutschland – Plädoyer für eine differenzierte Betrachtung, available at: https://www.dwd.de/DE/fachnutzer/wasserwirtschaft/entwicklung_starkniederschlag_deutschland_pdf.pdf (last access: 7 April 2018), 2016. 

de Toffol, S., Laghari, A. N., and Rauch, W.: Are extreme rainfall intensities more frequent? Analysis of rainfall patterns relevant to urban drainage systems, Water Sci. Technol., 59, 1769–1776, https://doi.org/10.2166/wst.2009.182, 2009. 

HLNUG: KLIMPRAX Starkregen, available at: https://www.hlnug.de/?id=11199, last access: 10 March 2018. 

Hoy, A., Schucknecht, A., Sepp, M., and Matschullat, J.: Large-scale synoptic types and their impact on European precipitation, Theor. Appl. Climatol., 116, 19–35, https://doi.org/10.1007/s00704-013-0897-x, 2013. 

Junghänel, T. and Deutschländer, T.: KOSTRA-DWD-2010-R – Bericht zur Revision der koordinierten Starkregenregionalisierung und -auswertung des Deutschen Wetterdienstes in der Version 2010, available at: https://www.dwd.de/DE/leistungen/kostra_dwd_rasterwerte/download/bericht_revision_kostra_dwd_2010.pdf (last access: 7 April 2018), 2017. 

Malitz, G., Beck, C., and Grieser, J.: Veränderungen der Starkniederschläge in Deutschland, in: Warnsignal Klima: Genug Wasser für alle?, edited by: Lozán, J., Graßl, H., Hupfer, P., Karbe, L., and Schönwiese, C.-D., Wissenschaftliche Auswertungen, Hamburg, Germany, 311–316, 2011. 

Mudelsee, M., Börngen, M., Tetzlaff, G., and Grünewald, U.: Extreme floods in central Europe over the past 500 years: Role of cyclone pathway “Zugstraße Vb”, J. Geophys. Res., 109, 1–21, https://doi.org/10.1029/2004JD005034, 2004. 

Müller, E. N. and Pfister, A.: Increasing occurrence of high-intensity rainstorm events relevant fort the generation of soil erosion in a temperate lowland region in Central Europe, J. Hydrol., 411, 266–278, https://doi.org/10.1016/j.jhydrol.2011.10.005, 2011. 

Werner, P. C. and Gerstengabe, F.-W.: Katalog der Großwetterlagen Europas (1881–2009), PIK Report No. 119, Potsdam, Germany, 1–146, 2010. 

Winterrath, T., Brendel, C., Hafer, M., Junghänel, T., Klameth, A., Walawender, E., Weigl, W., and Becker, A.: Erstellung einer radargestützten Niederschlagsklimatologie, available at: ftp://ftp-anon.dwd.de/pub/data/gpcc/radarklimatologie/Dokumente/Endbericht_Radarklimatologie_final.pdf, last access: 17 December 2017 

Zolina, O., Simmer, C., Kapala, A., Bachner, S., Gulev, S., and Maechel, H.: Seasonally dependent changes of precipitation extremes over Germany since 1950 from a very dense observational network, J. Geophys. Res., 113, 1–17, https://doi.org/10.1029/2007jd008393, 2008. 

Download
Short summary
Since the 1990s, precipitation data with a high temporal resolution (1 minute) have been recorded by two independent observation networks in Hesse/Central Germany. In our paper we assess and compare the data quality of the two networks and identify connections between precipitation intensity and large-scale atmospheric circulation patterns. Resulting differences between intense daily and sub-daily (15 minute) events underline the importance of enhancing short-duration precipitation measurements.