 | 03 Sep 2019
The similarity-based method: a new object detection method for deterministic and ensemble weather forecasts
Philippe Arbogast
Mayeul Destouches
Yamina Hamidi
Laure Raynaud
A new object-oriented method has been developed to detect hazardous phenomena predicted by Numerical Weather Prediction (NWP) models. This method, called similarity-based method, is looking for specific meteorological objects in the forecasts, which are defined by a reference histogram representing the meteorological phenomena to be detected. The similarity-based method enables to cope with small scale unpredictable details of mesoscale structures in meteorological models and to quantify the uncertainties on the location of the predicted phenomena. Applied to ensemble forecasts, the similarity-based method can be viewed as a particular case of neighborhood processing, allowing spatialized probabilities to be computed. An application to rainfall detection using forecasts from the AROME deterministic and ensemble models is presented.


Precipitation patterns predicted by cloud-resolving models are usually realistic, but for most of them there is still improvement to be done to forecast their exact locations in time and space. To overcome problems due to unpredictable details in mesoscale forecasts several spatialization approaches have been suggested, such as neighbourhood and object-based methods (Ebert, 2008; Gilleland et al., 2010; van der Plas et al., 2017). As explained by Schwartz and Sobash (2017), neighborhood methods can be viewed as a smoothing technique designed to produce scores at the grid scale (the pragmatic approach for instance, Theis et al., 2005). On the other hand, object-based methods try to capture the structures of meteorological features. They have been initialy developed for forecast verification, and usually define objects using a thresholding. For instance, the MODE method defines objects by thresholding smoothed fields of rainfall amounts (Davis et al., 2006). These methods are usually referred as up-scaling methods, and produce scores at scales larger than the grid scale by accounting for errors on object features (e.g. location and shape). In the present paper, we present a new object detection method, called the similarity-based method, that uses the entire statistical distribution of rainfall amounts in a neighborhood to detect areas of similar distribution. This similarity-based method has been introduced in Arbogast et al. (2016): model outputs are processed following a fuzzy object-oriented approach to extract large-scale precipitating features which are more predictable than mesoscale structures. The idea behind the similarity-based method is to mimic the hand-drawings of precipitating objects by forecasters, that focus on large scale features so that the fine-scale errors are less important. The similarity-based method has been applied to the AROME deterministic and ensemble models (Seity et al., 2011; Bouttier et al., 2012, 2016). After a description of the similarity-based method, some interesting results of an active storm from June 2018 will be presented.
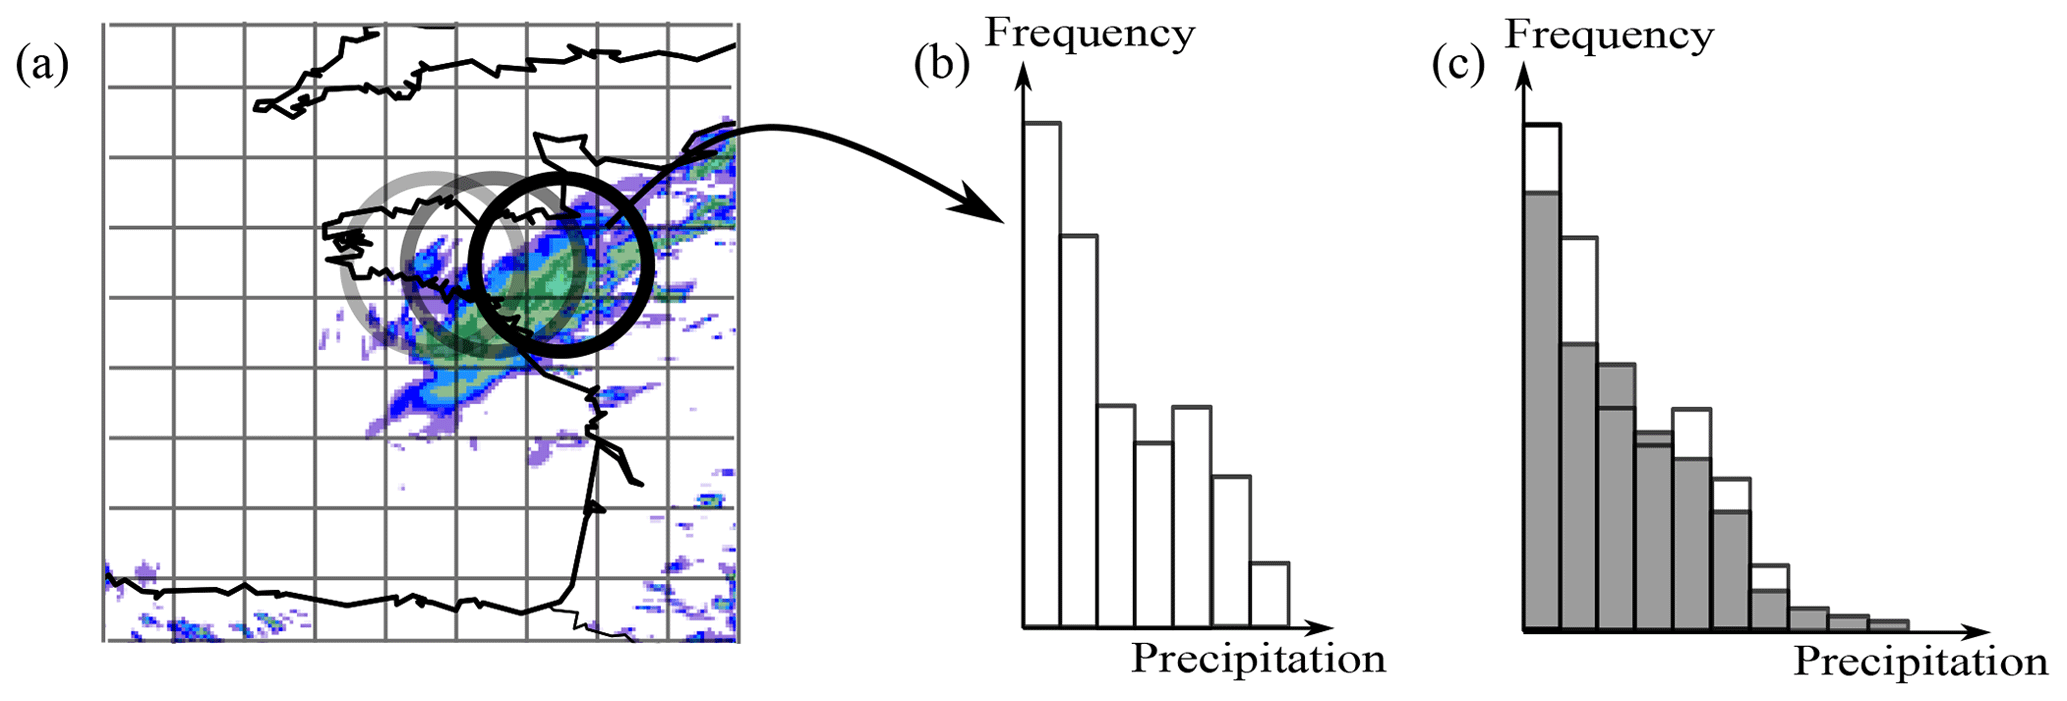
Figure 1The similarity-based method step by step: (a) the field is scanned using a grid coarser than the original one (resolution of 20 km), (b) at each point of this new coarsed grid the local histogram is computed from the high resolution field, and (c) the local histogram is then compared with a reference histogram to classify it.
The similarity-based method applied to precipitation forecasts has been introduced by Arbogast et al. (2016). An object is defined as a contour which delineates an area where precipitation are homogeneously distributed in terms of intensity. Precipitating objects are characterized by the precipitation distribution inside the contour, represented by the precipitation frequency histogram. Three types of object corresponding to three severity levels were considered: total, moderate and heavy rainfall objects. To define these objects, reference histograms have been computed on a full set of past cases for moderate and heavy precipitation. Meteorologists were asked to manually draw areas of moderate and heavy precipitation in NWP forecasts, and then associated histograms have been computed. Finally, the total precipitation object has been defined separately as the complementary object of the “no precipitation” object.
The object detection method compares the local histogram of the predicted precipitation field with the reference histograms. As the method seeks large scale objects, a grid coarser than the model resolution is used to scan the prediction field. At each point of the coarse grid, the local histogram is computed from the high-resolution precipitation field in a circular neighborhood whose radius, R, is set depending on the type of object. For instance, as heavy rainfall objects should be smaller than total rainfall objects, the radius used to detect them should be smaller (twice or more) than for the total rainfall detection (R=40 km for heavy rainfall objects and R=90 km for total precipitation object). The size of the neighborhood shifts the detection results. Using too large neighborhood can lead to non detection of small objects or misclassified ones, and using too small neighborhood can lead to break-up of large objects. The similarity s between the local histogram and the selected reference histogram is then computed using the L1 distance d between their corresponding cumulative distributions:
where h and href are the cumulative distribution functions of local and reference precipitation respectively, and B is the number of bins. In this work, there are B=26 bins of different size, from 0 to 500 mm. If the similarity between the local histogram and the selected reference histogram is higher than an empirically chosen threshold st, the grid point is inside an object associated with the reference histogram. Thus the objects are defined by the regions where the local precipitation histogram is highly similar with the reference histogram. The st threshold has been subjectively defined using a set of validation. This setting of st has been done independently for the three types of object. The similarity threshold increases with the precipitation intensity. The steps of the similarity-based method are summarized in Fig. 1.
Since the thresholds st are empirically chosen, the sensitivity of the object location to the st value should be accounted for. This sensitivity reflects the uncertainty about the exact location of the objects. To represent the location uncertainties, the similarity-based method is then applied Ncont times with randomly perturbed thresholds (Arbogast et al., 2016). For each precipitation type and at each point, the new similarity threshold sp(x, y) is given by:
where δs(x, y) is a threshold perturbation computed as follows: first a realization of a centered Gaussian law with standard deviation σs is attributed at each point of the coarse grid, then the resulting field is convoluted with a Gaussian distribution (with a bandwidth of one grid cell) to obtain spatially coherent threshold perturbations. The standard deviation σs is empirically chosen and is an order of magnitude smaller than the similarity threshold st. The Ncont generated contours are a priori equally likely contours and represent the uncertainty on the location of the object borders. The generated contours are called particles. The area spanned by the particles is called the uncertainty area.
After the detection of total rainfall and moderate rainfall objects, a Gaussian smoothing is applied to the contours to suppress unnecessary small scale details. The result of the similarity-based method applied to a deterministic forecast is the initial contour with the associated uncertainty area.
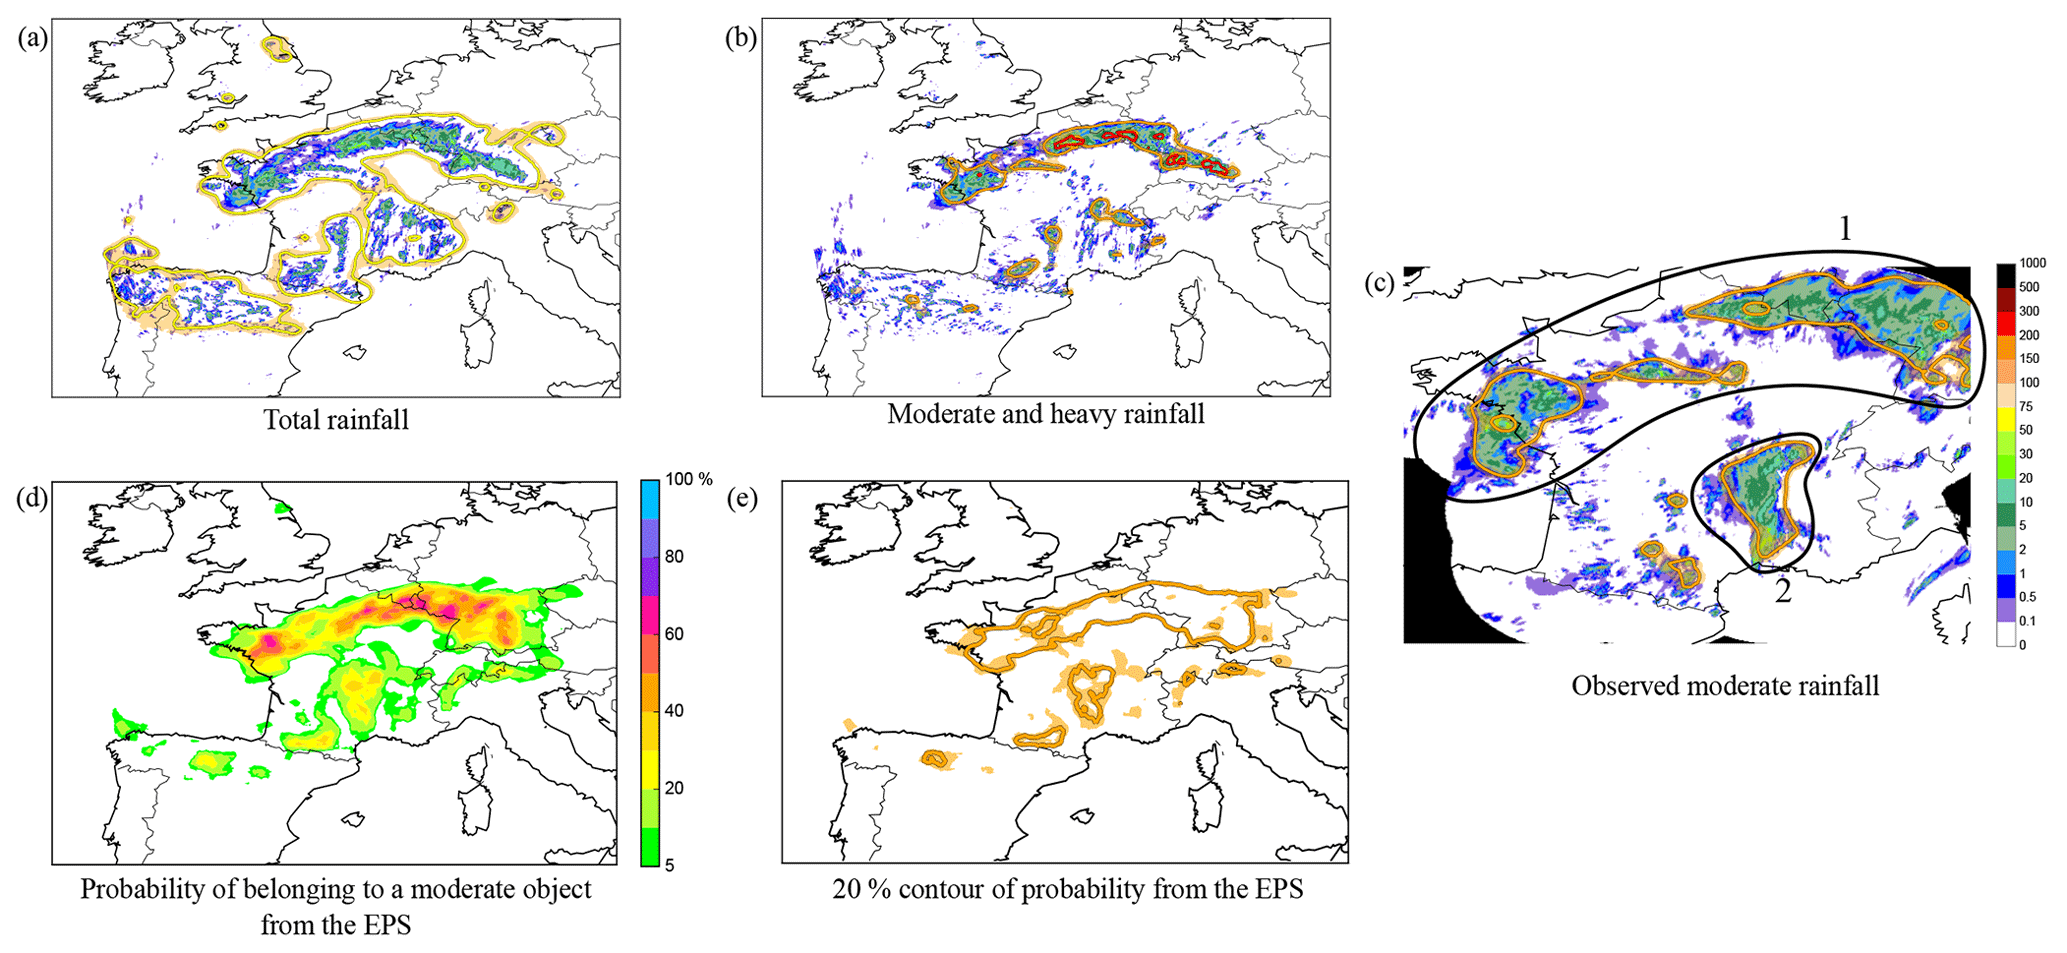
Figure 2(a) Total rainfall objects detected from hourly accumulated precipitation in the deterministic forecast by the AROME model for the 11 June 2018 at 16:00 UTC (the simulation started the 11 June 2018 at 00:00 UTC). (b) Same as (a) for moderate and heavy rainfalls, respectively in orange, and red. (c) Moderate rainfall objects detected from hourly accumulated precipitation from radar observations valid 11 June 2018 at 16:00 UTC. Two main areas of precipitation are identified. (d) Probability of belonging to a moderate object according to the 12 members of AROME EPS for the the 11 June 2018 at 16:00 UTC (the simulation started the 10 June 2018 at 21:00 UTC). (c) The 20 % contour of the probability map.
In the same way as for deterministic forecasts, the similarity-based method can be applied individually on all forecasts of all members of an ensemble prediction system (EPS). Hence, an initial contour and Ncont perturbed contours are detected for each of the Nens members. To summarize the information contained in the ensemble forecast, a probability map of belonging to an object of given type
The resulting probability map thus retrieves the uncertainties due to different model simulations, including the uncertainties on the object location for each member.
The results of the similarity-based method to the AROME deterministic model and ensemble members (AROME-EPS) are now presented. AROME is a convective-scale model, which covers the western Europe with a resolution of 1.3 km (Bouttier et al., 2012, 2016). The 12 members of the AROME-EPS cover the same domain with a resolution of 2.5 km (Brousseau et al., 2016). The similarity-based method has been applied to the AROME forecast for the 11 June 2018 at 16:00 UTC (start of the simulation the 11 June 2018 at 00:00 UTC). The three types of detected objects (total, moderate and heavy) from the deterministic model are represented Fig. 2a and b. The fuzzy areas are the points which are inside an object from 10 % to 90 % of the particles. The fuzzy areas represent the object detection uncertainty. This uncertainty is noticeable only where the precipitation contour is not obvious. The moderate rainfall objects detected in the observations are represented Fig. 2c. By comparing the forecast with the observations for the same valid date, one can notice that over the North of France moderate objects are well predicted (object 1, Fig. 2c), but the deterministic model fails to predict the large area of moderate precipitation observed over the Rhône valley (South East of France, object 2, Fig. 2c). It will be seen just beyond that using AROME-EPS forecast improves the prediction.
Figure 2d shows the moderate objects detected in the forecast of the AROME-EPS for the 11 June 2018 at 16:00 UTC (the simulation started the 10 June 2018 at 21:00 UTC). The absence of 100 % probability area indicates that the uncertainty due to different models is larger than the object detection uncertainty. To help the interpretation of the probability map, a probability threshold has been calibrated with respect to observations for each precipitation intensity level. The calibration has been done using 2 months of data (July and August 2017). During this period, AROME-EPS objects have been compared to observed objects using the Jaccard index (also known as intersection over union index). AROME-EPS objects are obtained by applying a given probability threshold to the probability map. Observed objects are derived from radar data by applying the similarity based method to the observations. The calibration is achieved by maximizing the similarity between them. The 50 %, 20 % and 10 % thresholds have been chosen respectively to identify the total, moderate and heavy rainfall objects, from the EPS. One can see a calibrated probability threshold decrease associated to a precipitation intensity increase. It is related to the lack of predictability of convective events (Raynaud et al., 2019). Figure 2e shows the 20 % contour of the probability to belong to a moderate object. The areas of moderate precipitation observed at 16:00 UTC over the North part of France and over the Rhône valley are well predicted by the AROME-EPS. Indeed the 20 % contour of probability reveals that two main objects are detected in the AROME-EPS forecast. The first one corresponds to the precipitation observed over the North part of France (object 1, Fig. 2c). The probabilistic object is larger than the observed one which makes sense considering the uncertainties introduced by the EPS. As for the deterministic forecast, the localization is well predicted. The second object corresponds to the observed precipitation over the Rhône valley (object 2, Fig. 2c). The object size is well predicted, but the localization is too West. Despite the localization error, the EPS forecast of this object is better than the deterministic forecast. In this case, the EPS model has a highly valuable input.
A similarity-based detection method has been developed to identify precipitating patterns according to their intensity distribution. Applications to deterministic and ensemble models suggest that the method is able to properly detect large-scale features, associated with a higher predictability than direct model output. Based on this method, an object-based evaluation of AROME and AROME-EPS models has been performed (Raynaud et al., 2019). Another benefit of the detection method is to provide synthetic products from the EPS. The similarity-based method could be combined with traditional neighborhood methods (grid-point or up-scaling) : detected objects could be used as neighborhoods. The advantage is that such neighborhoods are spatially uniformed meteorological structures since the local weather is homogeneous within objects. The similarity-based method could also be used in automatic diagnostics of heavy precipitations. The input of the similarity-based method in comparison with classical neighborhood method will be assessed. Improvements are expected for automatic generation of risk maps or spatio-temporally consistent weather reports. The next step is to complement the intensity-based classification with a texture-based segmentation to characterize areas with continuous and intermittent rainfall. Future works will also focus on multivariate objects to improve automatic detection of weather hazard events.
The data used in this work are available on request on the website https://donneespubliques.meteofrance.fr/ (last access: September 2019).
PA and LRa conceived of the presented idea. LRo, MD and YH contributed to the design and implementation of the research. LRo and LRa contributed to the analysis of the results and to the writing of the article.
The authors declare that they have no conflict of interest.
This article is part of the special issue “18th EMS Annual Meeting: European Conference for Applied Meteorology and Climatology 2018”. It is a result of the EMS Annual Meeting: European Conference for Applied Meteorology and Climatology 2018, Budapest, Hungary, 3–7 September 2018.
The authors wish to thank the reviewers for their helpful input and comments. The authors also thank Sandra Turner for her wise advice and for her communicative energy.
This paper was edited by Andrea Montani and reviewed by Susanne Theis and one anonymous referee.
Arbogast, P., Pannekoucke, O., Raynaud, L., Lalanne, R., and Mémin, E.: Object-oriented processing of CRM precipitation forecasts by stochastic filtering, Q. J. Roy. Meteorol. Soc., 142, 2827–2838, 2016. a, b, c
Bouttier, F., Vié, B., Nuissier, O., and Raynaud, L.: Impact of stochastic physics in a convection-permitting ensemble, Mon. Weather Rev., 140, 3706–3721, 2012. a, b
Bouttier, F., Raynaud, L., Nuissier, O., and Ménétrier, B.: Sensitivity of the AROME ensemble to initial and surface perturbations during HyMeX, Q. J. Roy. Meteorol. Soc., 142, 390–403, 2016. a, b
Brousseau, P., Seity, Y., Ricard, D., and Léger, J.: Improvement of the forecast of convective activity from the AROME-France system, Q. J. Roy. Meteorol. Soc., 142, 2231–2243, 2016. a
Davis, C., Brown, B., and Bullock, R.: Object-based verification of precipitation forecasts. Part I: Methodology and application to mesoscale rain areas, Mon. Weather Rev., 134, 1772–1784, 2006. a
Ebert, E. E.: Fuzzy verification of high-resolution gridded forecasts: a review and proposed framework, Meteorol. Appl., 15, 51–64, 2008. a
Gilleland, E., Ahijevych, D. A., Brown, B. G., and Ebert, E. E.: Verifying forecasts spatially, B. Am. Meteorol. Soc., 91, 1365–1376, 2010. a
Raynaud, L., Arbogast, P., Destouches, M., Pechin, I., and Rottner, L.: Object-based verification metrics applied to evaluation and weighting of convective-scale forecasts, Q. J. Roy. Meteorol. Soc., https://doi.org/10.1002/qj.3540, in press, 2019. a, b
Schwartz, C. S. and Sobash, R. A.: Generating probabilistic forecasts from convection-allowing ensembles using neighborhood approaches: A review and recommendations, Mon. Weather Rev., 145, 3397–3418, 2017. a
Seity, Y., Brousseau, P., Malardel, S., Hello, G., Bénard, P., Bouttier, F., Lac, C., and Masson, V.: The AROME-France convective-scale operational model, Mon. Weather Rev., 139, 976–991, 2011. a
Theis, S., Hense, A., and Damrath, U.: Probabilistic precipitation forecasts from a deterministic model: a pragmatic approach, Meteorol. Appl., 12, 257–268, 2005. a
van der Plas, E., Schmeits, M., Hooijman, N., and Kok, K.: A Comparative Verification of High-Resolution Precipitation Forecasts Using Model Output Statistics, Mon. Weather Rev., 145, 4037–4054, 2017. a