 | 18 Apr 2018
Comparison of several satellite-derived databases of surface solar radiation against ground measurement in Morocco
Mathilde Marchand
Abdellatif Ghennioui
Etienne Wey
Lucien Wald
HelioClim-3v4 (HC3v4), HelioClim-3v5 (HC3v5) and the radiation service version 2 of the Copernicus Atmosphere Monitoring Service (CAMS-Rad) are databases that contain hourly values of solar radiation at ground level. These estimated hourly irradiations are compared to coincident measurements made at five stations in Morocco. The correlation coefficients between measurements and estimates are similar for the three databases and around 0.97–0.98 for global irradiation. For the direct irradiation, the correlation coefficients are around 0.70–0.79 for HC3v4, 0.79–0.84 for HC3v5 and 0.78–0.87 for CAMS-Rad. For global irradiation, the bias relative to the average of the measurements is small and ranges between −6 and −1 % for HC3v4, −4 and 0 % for HC3v5, and −4 and 7 % for CAMS-Rad; HC3v4 and HC3v5 exhibit a tendency to slightly underestimate the global irradiation. The root mean square error (RMSE) ranges between 53 (12 %) and 72 Wh m−2 (13 %) for HC3v4, 55 (12 %) and 71 Wh m−2 (13 %) for HC3v5, and 59 (11 %) and 97 Wh m−2 (21 %) for CAMS-Rad. For the direct irradiation, the relative bias ranges between −16 and 21 % for HC3v4, −7 and 22 % for HC3v5, and −18 and 7 % for CAMS-Rad. The RMSE ranges between 170 (28 %) and 210 Wh m−2 (33 %) for HC3v4, 153 (25 %) and 209 Wh m−2 (40 %) for HC3v5, and 159 (26 %) and 244 Wh m−2 (39 %) for CAMS-Rad. HC3v5 captures the temporal and spatial variability of the irradiation field well. The performance is poorer for HC3v4 and CAMS-Rad which exhibit more variability from site to site. As a whole, the three databases are reliable sources on solar radiation in Morocco.


Solar radiation is an essential variable in the ocean-climate system and the assessment of its intensity and variability in space and time at ground level is the object of many works, see e.g. Bell et al. (2009), Bengulescu et al. (2016, 2018), Blanc et al. (2011, 2015), Lefèvre et al. (2007), Wahab et al. (2009). Solar radiation is also a crucial factor which influences life on Earth for animals, plants (Bois et al., 2008; Colombo et al., 2009; Wagner et al., 2012) and humans (Juzeniene et al., 2011). The energy received from the Sun and impinging on a horizontal surface of unit surface located at ground level is called the surface solar downward irradiation and is abbreviated as SSI.
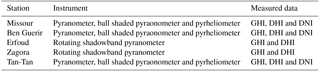
Table 1Instrument description and measured data for each station (from Schüler et al., 2016).
The most accurate means of assessing the SSI are ground-based instruments. They may offer high to good quality measurements if well maintained. However, they are quite few and other means were and still are looked for to assess the SSI at any place and any time. For example, meteorological reanalyses offer estimates of SSI covering the whole world that span several decades back in time. Boilley and Wald (2015), Bengulescu et al. (2017) and Trolliet et al. (2017) have analyzed the quality of several reanalyses: ERA-Interim, ERA-5, MERRA, and MERRA-2, against ground measurements of SSI. These authors reported that reanalyses often exhibit cloudy conditions while actual conditions are cloud-free and vice versa. Satellite images are another means to getting a synoptic view of the SSI and may supplement radiometric measurements (Lefèvre et al., 2014; Wagner et al., 2012).
Several databases have been constructed from images acquired by the Meteosat series of satellites. Three of these are dealt with hereafter: the HelioClim-3 databases (version 4 and version 5) and the CAMS Radiation Service (version 2), where CAMS stands for Copernicus Atmosphere Monitoring Service. Each database is available online and has more than several hundred users each year (Thomas et al., 2016a). Validations of each database are routinely performed and their results are published, thus supplying users with up to date knowledge of each database. For example, validation is performed every quarter that compares ground-based measurements made at several stations in Europe, Africa and South America to the SSI estimated by the CAMS Radiation Service. A report is published and made available on-line at https://atmosphere.copernicus.eu/validation-supplementary-products (last access: 17 April 2018). Joint validations of the three databases have also been performed for various climates in Europe (Thomas et al., 2016b) and for more specific geographical regions, such as Brazil (Thomas et al., 2016a), Egypt (Eissa et al., 2015a), Oman (Marchand et al., 2017) and the tropical Atlantic Ocean (Trolliet et al., 2017).
Pursuing this effort is important to users of the databases and the present work is a contribution to this on-going activity. Like the previous ones dealing with specific geographical regions, this work addresses the issue of the spatial consistency of errors. In other words, it addresses the question of how much the accuracy found in the retrieval of hourly global irradiation for a given database varies within a region of similar climate. A large variability decreases the confidence a user may have in using this database for an entire region. The aim of this study is to validate and discuss the errors of the hourly SSI extracted from the three databases; HC3v4, HC3v5 and CAMS Radiation Service against reference data collected from five stations in northern and central parts in Morocco. The climate at the five stations is Csa in the Köppen–Geiger climate classification, i.e. a temperate climate with dry and hot summers (Peel et al., 2007).
The five stations are: Missour, Ben Guerir, Erfoud, Zagora and Tan-Tan (Fig. 1). Tan-Tan is close to the seashore at an altitude of 75 m a.m.s.l. (above mean sea level). The other sites are more mountainous with altitudes ranging from 450 m up to 1107 m (Fig. 1).

Figure 1Geographical locations, coordinates, and period of measurements of the five stations.
Missour, Erfoud, Zagora and Tan-Tan were set up within the EnerMENA project (Schüler et al., 2016). The Missour, Ben Guerir, and Tan-Tan stations are equipped with one pyrheliometer that measures the direct irradiation BN received on a plane normal to the direction of the sun and two pyranometers, one measuring the global SSI G, and the other equipped with a shadow ball measuring the diffuse irradiation D (Table 1). The Erfoud and Zagora stations are equipped with a rotating shadowband irradiometer that measures G and D, from which one may compute BN. At all five stations, the measurements provide 1 min measurements of SSI (Table 1). The measurements are collected by the IRESEN, the national research institute for solar energy and new energies in Morocco. For the purpose of this work, measurements were aggregated as hourly irradiations for both G and BN. Measurements are available from 2013 to 2016, except at Ben Guerir where the period ranges from 2015 to 2016.
The time series of G and BN were controlled for their quality according to the WMO (1981) procedure with details given in Korany et al. (2016). This automated procedure checks whether the measurements exceed physically possible and extremely rare limits and flags them as suspicious. A visual check is performed on the results of the automated procedure to remove other outliers. In this work, all data flagged as suspicious were rejected. In addition, the lowest values can be noise and are therefore insignificant in a validation process. These measurements were removed if they were less than a threshold set at 50 Wh m−2. This threshold is approximately 1.5 times the uncertainty (defined as twice the standard deviation of the errors) given by WMO (2008) for measurements of good to moderate quality.
The European Space Agency initiated the Meteosat series of geostationary satellites to provide services to the meteorological community by imaging clouds and other phenomena over Europe, Africa and Atlantic Ocean in a synoptic manner. The Meteosat programme is currently operated by EUMETSAT. The Earth observing instrument aboard the first generation of Meteosat satellites comprised three channels, while the instrument aboard the second generation offered 12 channels. The greater the number of channels, the more numerous and the more accurate the cloud properties that can be deduced from the images.
A series of methods, called Heliosat, has developed since the 1980s in order to convert images acquired by satellites into fields of SSI (Cano et al., 1986). The principle of Heliosat is that the appearance of a cloud over a pixel yields an increase in radiance in the images taken in the visible range by the satellite. A cloud index is computed that quantifies the change between the observed radiance and the radiance that should be observed if the sky were cloud-free. The greater the cloud index, the greater the extinction of the downwelling radiation by the atmosphere. Of interest here, is the Heliosat-2 method, proposed by Rigollier et al. (2004), which is easier to implement than the original one by Cano et al. (1986) and gives more accurate results. A detailed analysis of the input uncertainties and their influence on the Heliosat-2 outcomes was published by Espinar et al. (2009). Heliosat-2 makes use of a clear-sky model, which is a model that estimates the SSI in cloud-free conditions. The European Solar Radiation Atlas, abbreviated as ESRA (Greif et al., 2000; Page et al., 2001), proposes such a model, called the ESRA clear-sky model, which is embedded within Heliosat-2 (Rigollier et al., 2000, 2004).
Heliosat-2 was first applied to images of the first generation of the Meteosat series to create and update the HelioClim-1 database of daily SSI (Lefèvre et al., 2007, 2014) within the HelioClim project of MINES ParisTech (Blanc et al., 2011). Cros et al. (2006) proposed a procedure for allowing the application of Heliosat-2 to the images from the second generation of Meteosat satellites. Since 2004, Meteosat images are acquired every 15 min and routinely processed to update the HelioClim-3 database of 15 min SSI, abbreviated hereafter as HC3. In order to correct some drawbacks observed since its inception and to bring improvements and corrections to the original HC3 database, post-processing algorithms are applied on-the-fly when a request for a time-series of SSI is made. For example, the SSI stored in HC3 is modulated to account for the elevation of the required location and the shadowing effect of the horizon. This approach avoids several re-processing phases of the whole set of images dating back to 2004. HC3 version 4, abbreviated as HC3v4 is currently the most advanced version of HC3 that makes use of the ESRA clear-sky model.
One drawback in HC3v4 is the use of a fixed climatology of the atmosphere turbidity as input to the ESRA clear-sky model. To overcome it, Qu et al. (2014) have proposed an improvement to HC3v4, called the HC3 version 5 and abbreviated as HC3v5. This improvement is built on (i) the approximation of Oumbe et al. (2014) wherein the global or direct SSI under all-sky conditions is the product of the cloud-free SSI and a factor that is a function of the solar zenithal angle, cloud properties and ground reflective properties, (ii) the recent McClear clear-sky model (Lefèvre et al., 2013), and (iii) the recent results on aerosol properties, and total column content in water vapour and ozone produced by the CAMS that are input to McClear.
The more recent Heliosat-4 method (Qu et al., 2017) is entirely based on the approximation of Oumbe et al. (2014). The cloud-free SSI is given by the McClear model with CAMS atmospheric constituents as inputs (Lefèvre et al., 2013). The German Aerospace Center (DLR) processes the multispectral images of the Meteosat satellite every day using the APOLLO method (Qu et al., 2017) and provides the cloud properties as input to Heliosat-4. The other inputs are the solar angles computed using the SG2 algorithm (Blanc and Wald, 2012) and the data set of quantities describing the bidirectional reflectance of the ground of Blanc et al. (2014). The CAMS Radiation Service, abbreviated as CAMS-Rad, exploits the Heliosat-4 method.
The three databases provide time series of 15 min SSI, from 2004 onwards, for any place located within the field of view of the Meteosat satellites. They can be accessed online on the SoDa web site (http://www.soda-pro.com, last access: 17 April 2018) (Gschwind et al., 2006).
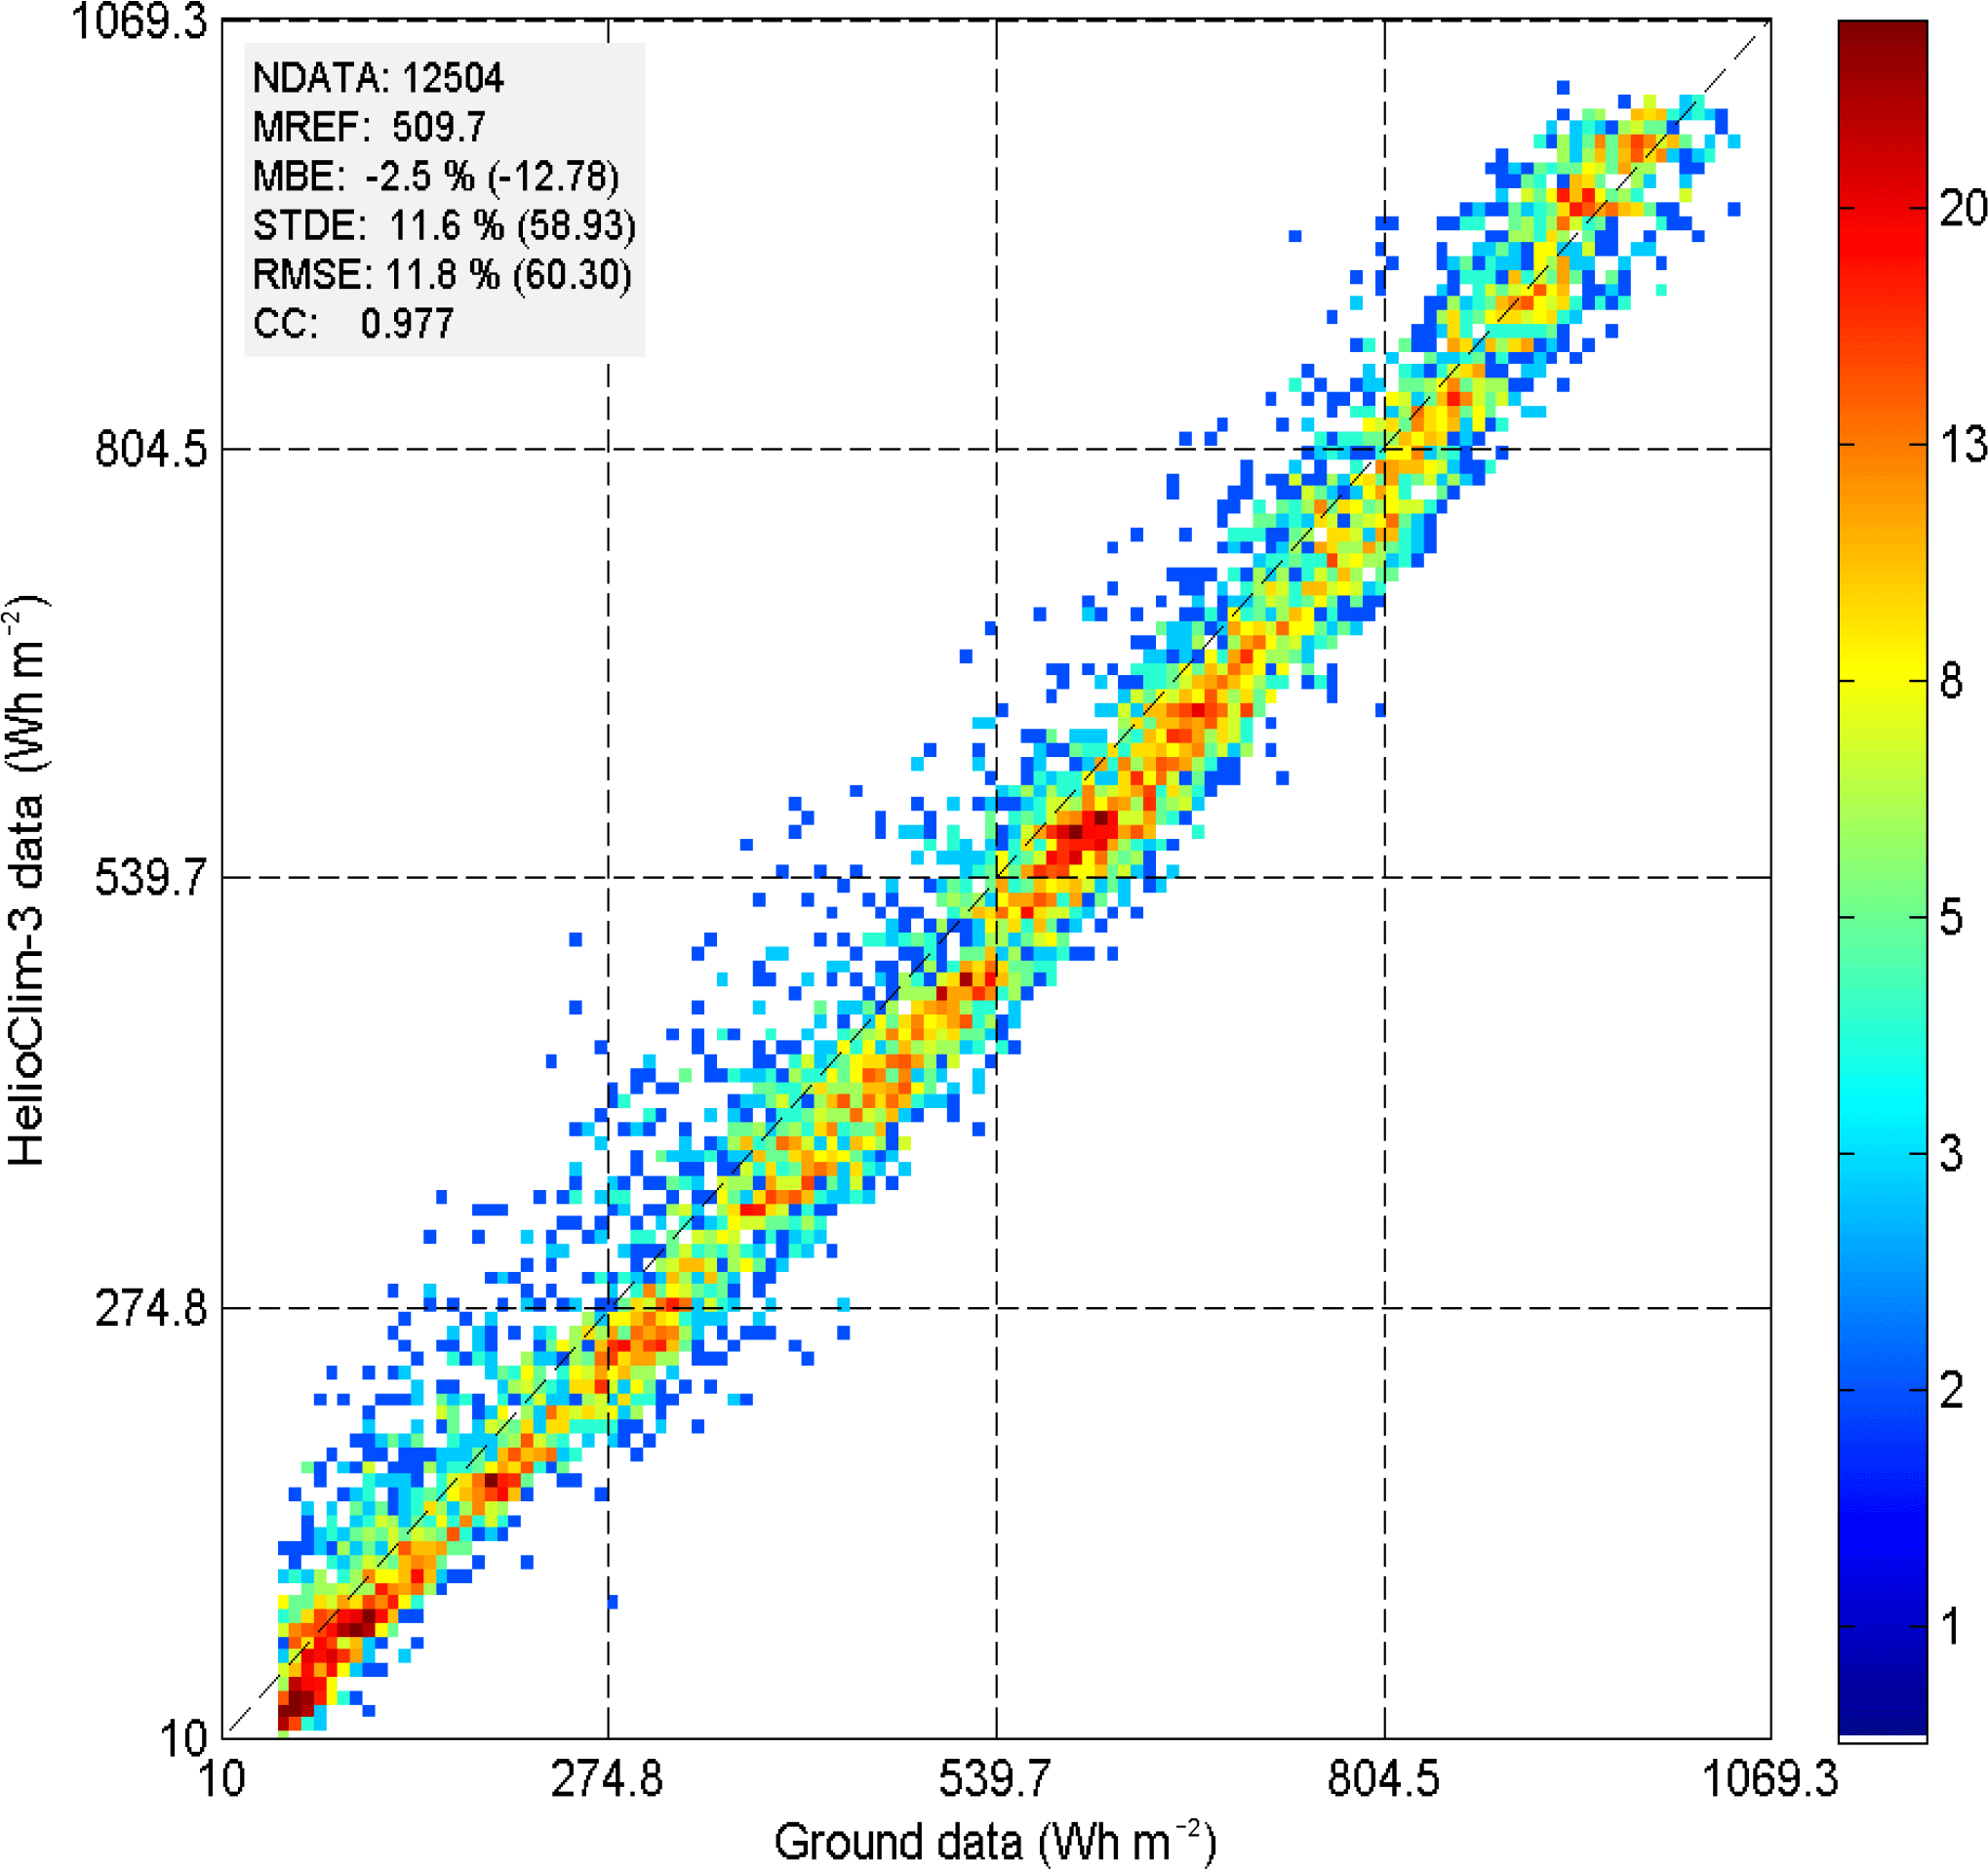
Figure 22-D histogram of the in situ measurements (horizontal axis) and HC3v4 estimates (vertical axis) at Erfoud. The number of samples (NDATA), the mean of the measured hourly irradiations (MREF), the bias (MBE), the standard-deviation (STDE), root mean square of the errors (RMSE) in Wh m−2, and the correlation coefficient (CC) are reported in the upper left corner. Relative values are obtained by the division of the quantity by MREF.
HC3v4, HC3v5 and CAMS-Rad time series of hourly irradiation G and BN were obtained from the SoDa web site at the five stations. These time-series also contain the irradiation at the top of atmosphere on a horizontal surface, E0. From G and E0, one may compute the clearness index KT (= G∕E0). The validation against in-situ measurements was performed for G, BN, and KT.
The validation followed the ISO (1995) (International Organization for Standardization) standard wherein the differences are obtained by subtracting measurements from the database estimates. The sets of differences are summarized by the bias (mean of the differences), the standard deviation of the differences and the root mean square error (RMSE). These quantities are computed relative to the mean of the measurements at a given site. Correlation coefficients are also computed. 2-D histograms between measurements and estimates, also known as scatter density plots, are drawn.
As an example, the 2-D histograms for G are presented for Erfoud (Figs. 2–4). The number of samples in each bin is coded in colour, increasing from dark blue (1 sample) to dark red (a few tens). The number of samples, the mean of the measurements, the bias, the standard deviation, the RMSE, and the correlation coefficient are also given. In this example, the points are fairly aligned along the 1 : 1 line for the three databases. The other sites exhibit similar trends. The correlation coefficients are large in the three cases; the changes in G are well represented by the three databases. The scattering is limited in the three graphs. The relative standard deviation is around 12–13 % of the mean of the measurements. The bias is negative for HC3v4 (underestimation of −13 Wh m−2, −3 %, Fig. 2). One can see in Fig. 2 that the points are located just below the 1 : 1 line, except for the largest irradiations where the estimates match the in situ measurements. The bias is slightly negative for HC3v5 (−6 Wh m−2, −1 %). One can observe in Fig. 3 a slight underestimation for G less than 400 Wh m−2, an error close to 0 for G in [400, 850] Wh m−2 and, a slight overestimation for G greater than 850 Wh m−2. The situation is different for CAMS-Rad: the bias is slightly positive (7 Wh m−2, 1 %); one can observe in Fig. 4 errors close to 0 for G less than 300 Wh m−2, and an increasing overestimation as G increases.
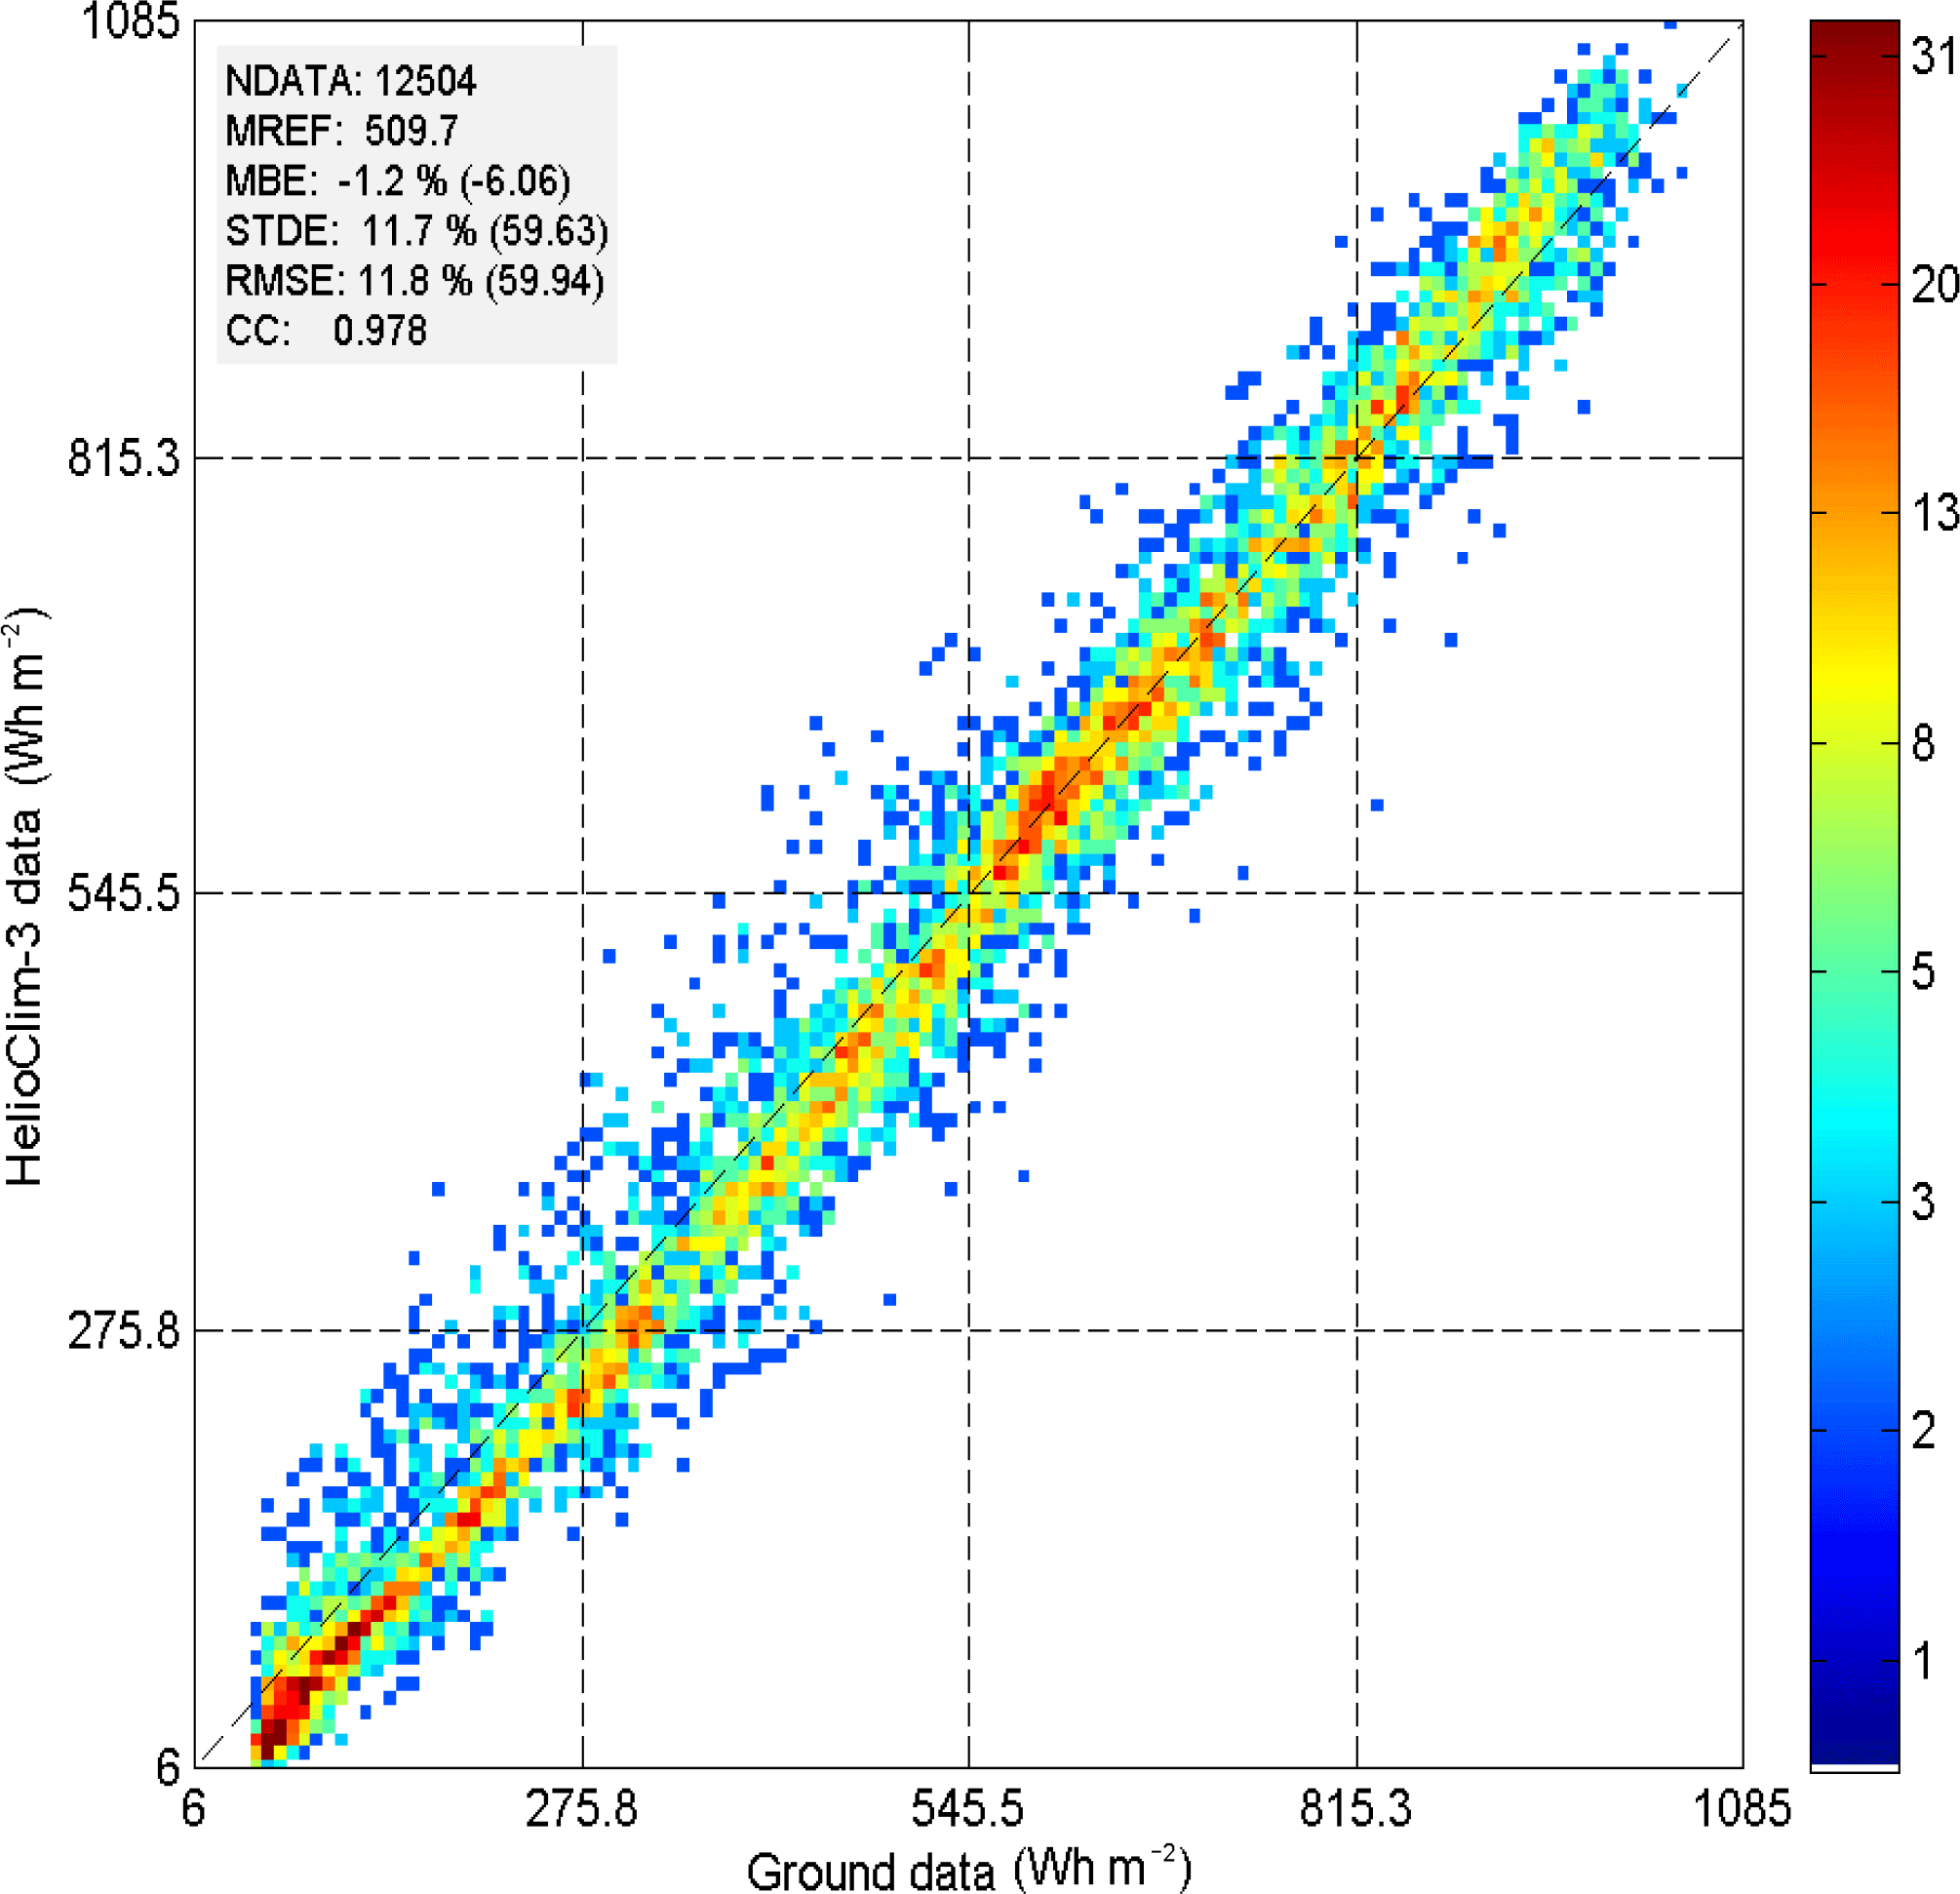
Figure 32-D histogram of the in situ measurements (horizontal axis) and HC3v5 estimates (vertical axis) at Erfoud. The number of samples (NDATA), the mean of the measured hourly irradiations (MREF), the bias (MBE), the standard-deviation (STDE), root mean square of the errors (RMSE), in Wh m−2, and the correlation coefficient (CC) are reported in the upper left corner. Relative values are obtained by the division of the quantity by MREF.
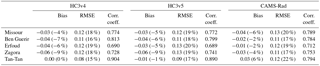
Table 2Global hourly SSI. Number of coincident data, mean of measurements, bias and RMSE and correlation coefficient for HC3v4, HC4v5 and CAMS-Rad at the five sites. RMSE: root mean square error
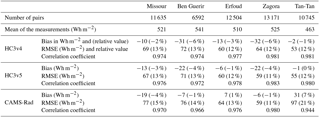
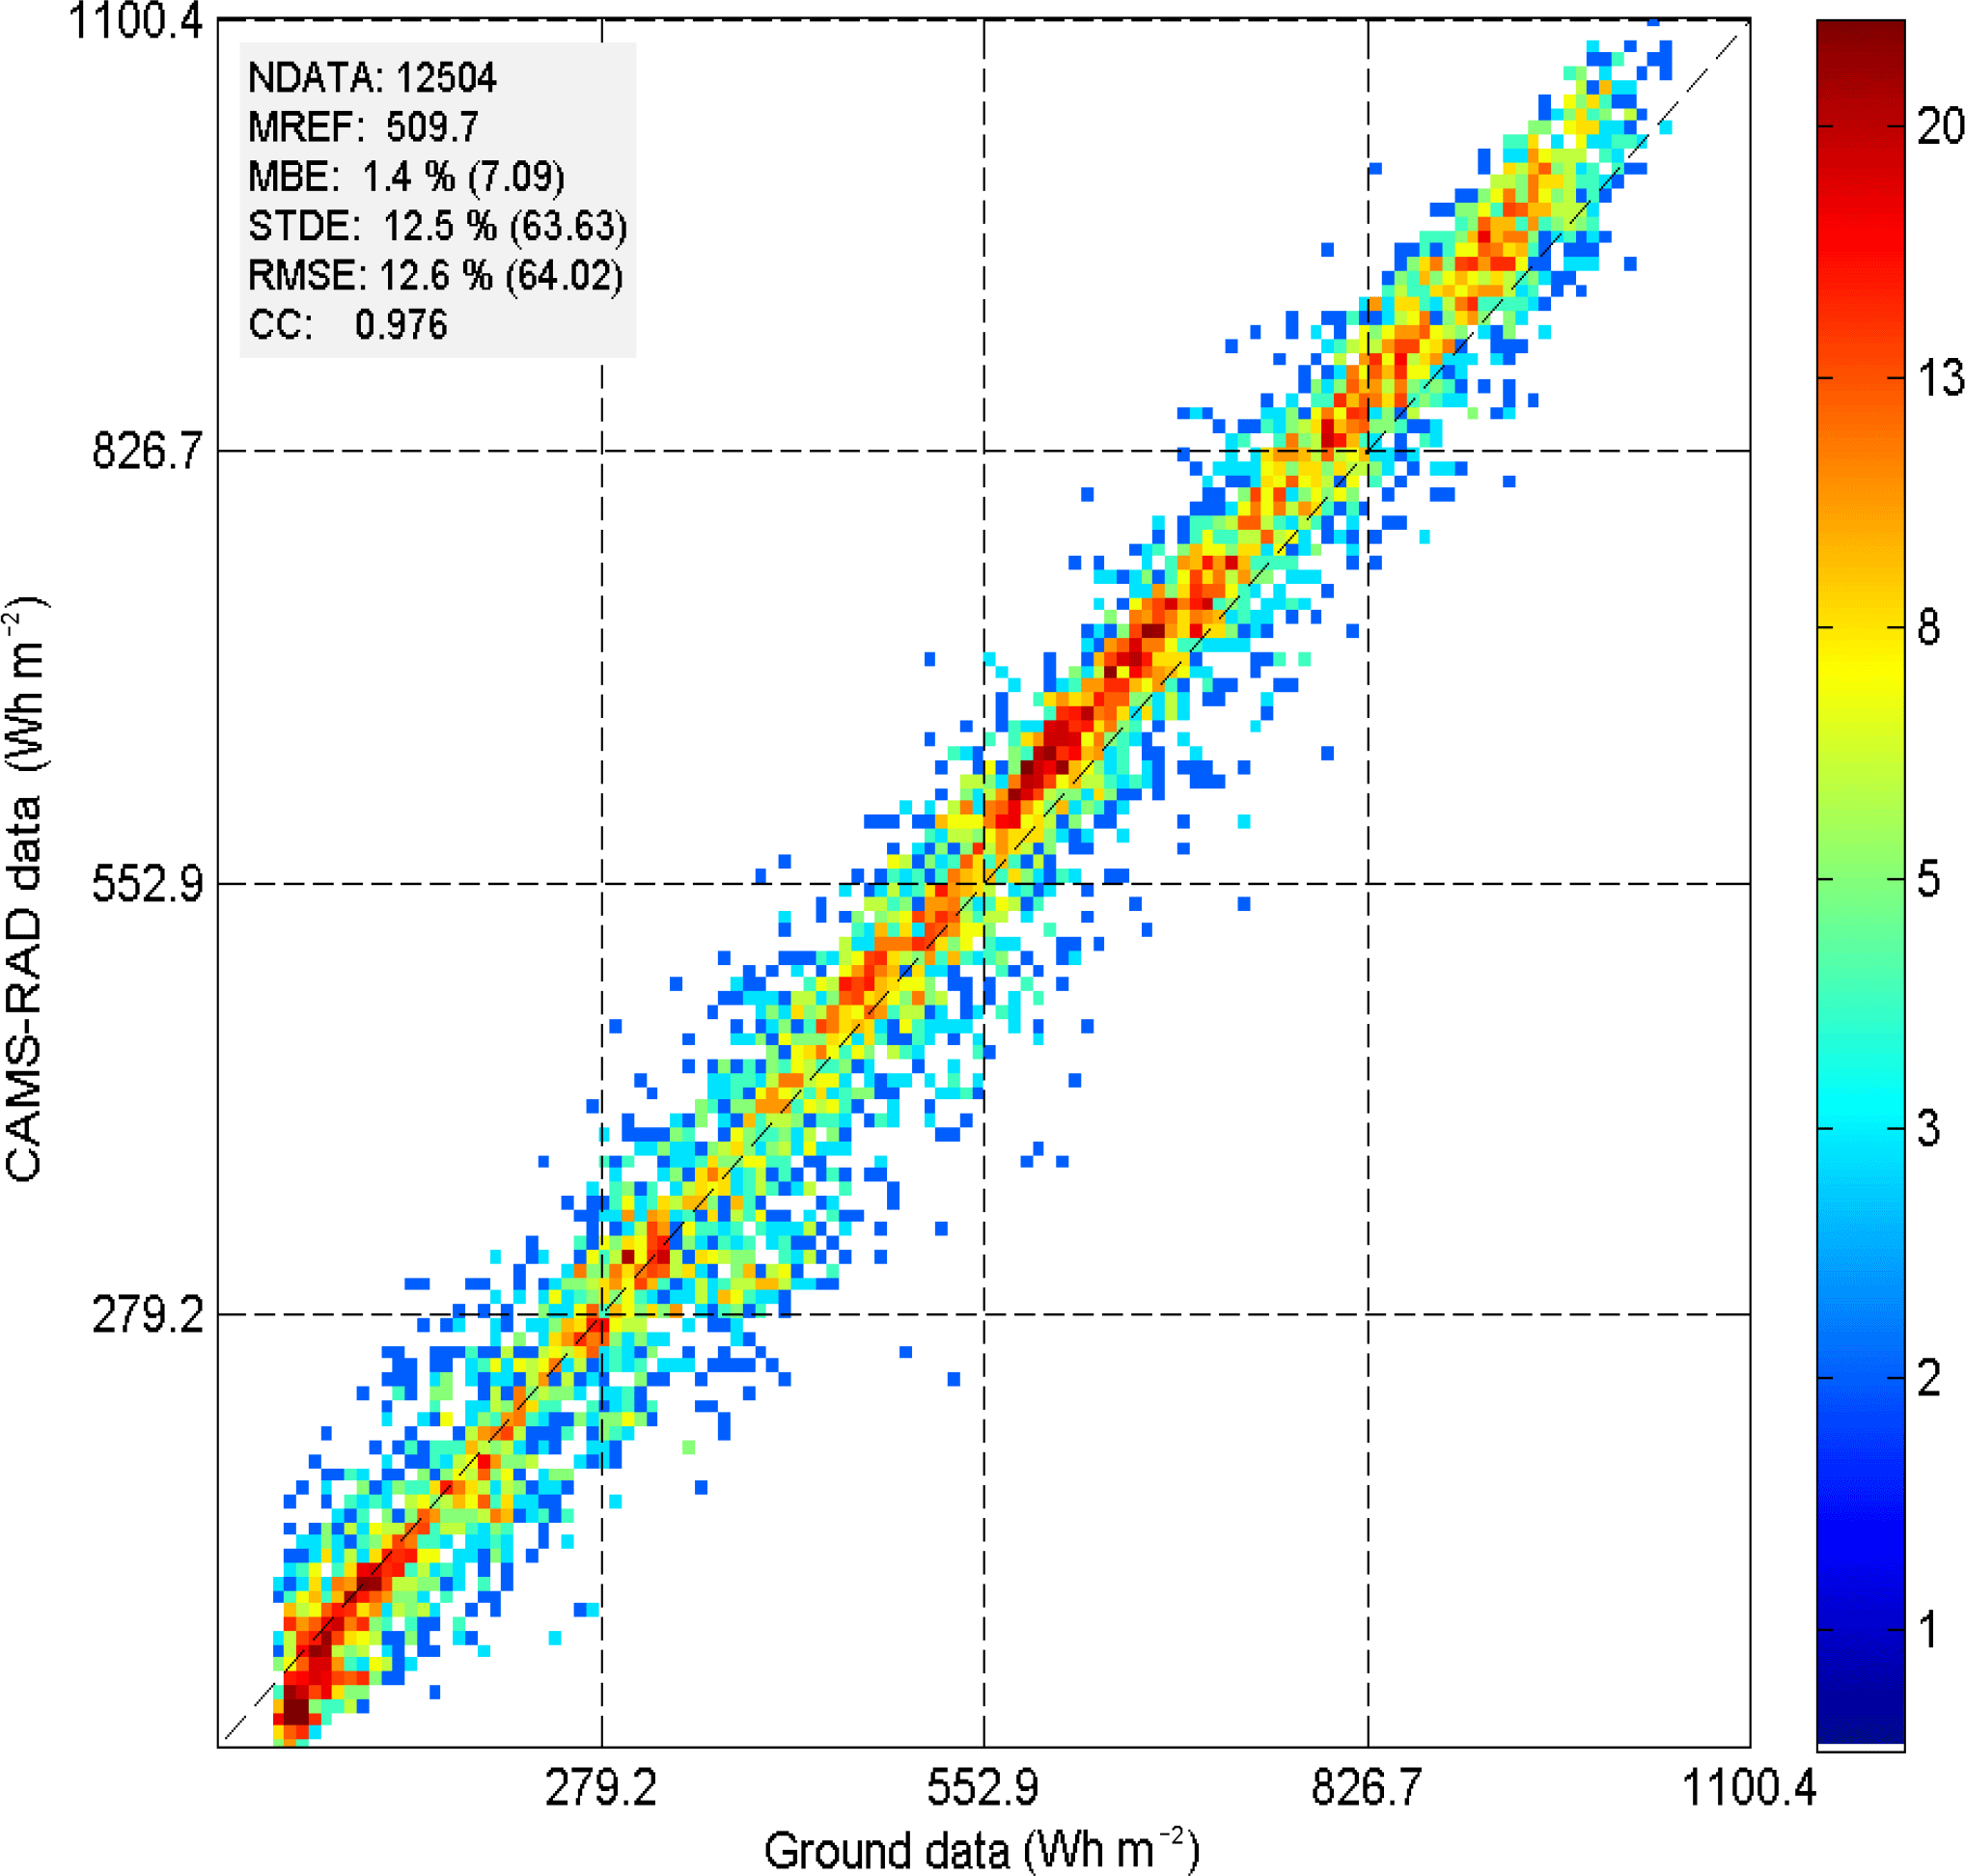
Figure 42-D histogram of the in situ measurements (horizontal axis) and CAMS-Rad estimates (vertical axis) at Erfoud. The number of samples (NDATA), the mean of the measured hourly irradiations (MREF), the bias (MBE), the standard-deviation (STDE), root mean square of the errors (RMSE), in Wh m−2, and the correlation coefficient (CC) are reported in the upper left corner. Relative values are obtained by the division of the quantity by MREF.
Table 2 reports the number of samples used for validation, the mean of the ground-based measurements, the bias and RMSE and their relative values, and the correlation coefficient for each database and each station for G. Table 3 reports the same quantities but for BN and Table 4 deals with the clearness index.
The correlation coefficient for G often exceeds 0.98 at all stations and all databases (Table 2). As the squared correlation coefficient, also termed the coefficient of determination, is related to the variance of the measurements, this confirms that the variability of the measurements in time is well reproduced by each database for Morocco. As a whole, HC3v4 and HC3v5 exhibit similar correlation coefficients, which are slightly greater than those for CAMS-Rad. These large correlation coefficients are partly due to the fact that the Heliosat models, like many others, accurately estimate the solar zenithal angle during the day leading to a de facto strong correlation between ground-based measurements and satellite-derived estimates of SSI and hiding potential weaknesses in models. The bias for G is always negative for HC3v4 and HC4v5; the bias for HC3v5 is a bit less in absolute value than that for HC3v4 (Table 2). It ranges between −32 and −2 Wh m−2 for HC3v4, i.e. an amplitude of 30 Wh m−2. The range of variation of the bias is smaller for HC3v5: the bias ranges between −22 and −1 Wh m−2, i.e. an amplitude of 21 Wh m−2 only. The bias is more variable from one site to another for CAMS-Rad compared to HC3v4 and HC3v5: it ranges between −19 and 31 Wh m−2, i.e. an amplitude of 50 Wh m−2. Actually, Tan-Tan exhibits a large positive bias for CAMS-Rad (31 Wh m−2). If this site is removed, the bias has a more limited range, from −19 to 7 Wh m−2, and the corresponding amplitude (26 Wh m−2) is similar to that for HC3v4. The RMSE is similar for HC3v4 and HC3v5 and ranges between 53 and 72 Wh m−2, and 55 and 71 Wh m−2 respectively. The RMSE is greater for CAMS-Rad and ranges from 59 to 77 Wh m−2, with an exception of 97 Wh m−2 at Tan-Tan.
Table 3Direct hourly SSI. Number of coincident data, mean of measurements, bias and RMSE and correlation coefficient for HC3v4, HC4v5 and CAMS-Rad. RMSE: root mean square error.
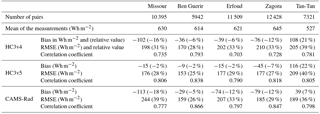
Table 4Clearness index. Bias, RMSE and correlation coefficient for HC3v5 and CAMS-Rad.
The correlation coefficient for BN depends on the database (Table 3). The greatest correlation coefficients are attained for CAMS-Rad and range from 0.78 to 0.87. Those for HC3v5 are slightly less and are less variable from site to site; they range from 0.79 to 0.84. The correlation coefficients range from 0.70 to 0.79 for HC3v4. It can be concluded that each database reproduces fairly well the hourly variation in BN in Morocco. The bias in BN is negative for all databases except at Tan-Tan where it is positive. Biases are fairly similar for HC3v4 and CAMS Radiation Service; they range respectively between −102 and −36 Wh m−2, and −113 and −29 Wh m−2 (108 and 39 Wh m−2 at Tan-Tan). The bias for HC3v5 is less than the other databases in absolute value. It ranges from −45 to −9 Wh m−2 (116 Wh m−2 at Tan-Tan). Similar observations are made for the RMSE of BN. The smallest RMSEs are observed for HC3v5; they range between 153 and 177 Wh m−2 (209 Wh m−2 at Tan-Tan because of the large bias). The relative standard deviation is 25–30 %. The RMSE for HC3v4 ranges from 170 to 210 Wh m−2 (205 Wh m−2 at Tan-Tan). That for CAMS Radiation Service varies more from site to site than HC3v4 or HC3v5: it ranges from 159 to 244 Wh m−2 (189 Wh m−2 at Tan-Tan). There is a difference between the Heliosat-2 and Heliosat-4 algorithms: the latter estimates both G and BN (in CAMS-Rad) while for HC3v4 and HC3v5, BN is estimated from G via an empirical algorithm (Ruiz-Arias, 2009). In 2-D histograms of BN for CAMS-Rad (not shown), the estimated BN is often close to 0 while the actual BN is large. This happens at Erfoud, Missour and Zagora. This relates to errors in detection of clouds and the computation of their optical depth in Heliosat-4 that may arise in this eastern part of Northern Morocco due to ground and weather characteristics, especially for large solar zenithal angles. In several cases, while the actual BN is large, the cloud analysis from Meteosat images indicated a fully cloudy pixel with a cloud coverage of 100 %. In such conditions, the optical depth of the cloud is set in APOLLO to an arbitrary value: 0.5, even if the calculation provides a smaller value. The influence of the resulting error in cloud optical depth is the greatest at large solar zenithal angles, which are encountered at the beginning and end of the day. This drawback contributes to an increased bias in absolute value and standard deviation, hence an increased RMSE.
KT is less dependent than G on the solar zenithal angle and is a stricter indicator of the ability of a database in assessing the optical state of the atmosphere. The correlation coefficient for KT is always less than that of G. In Table 4, HC3v4 and HC3v5 offer the same correlation coefficients for KT: they often exceed 0.70 and are up to 0.90 for Tan-Tan (0.98 for G). The correlation coefficient is less variable for CAMS-Rad and ranges from 0.71 to 0.79. It can be concluded that each database reproduces the hourly variation in KT quite well. As for KT (Table 4), the bias ranges between −0.06 and −0.03 for HC3v4 and HC3v5 (0.00 and −0.01 at Tan-Tan) and −0.04 and −0.01 for CAMS-Rad (0.03 at Tan-Tan). The RMSE is approximately 0.12 for the three databases, except at Tan-Tan for HC3v4 and HC3v5: 0.08 and 0.09 respectively. 2-D histograms for KT (not shown) show that the reference KT is often greater than 0.7, denoting frequent cloud-free skies. There is a slight underestimation of KT by HC3v4. Tan-Tan is an exception with points aligned on the 1 : 1 line and a slight underestimation for the greatest clearness indices. HC3v5 exhibits also a slight but systematic underestimation of KT but limited to KT less than 0.7. For KT > 0.7, the errors are small and it is believed that this is due to the use of the McClear model with CAMS estimates of atmospheric constituents as inputs. Several studies have shown the accuracy of this ensemble McClear / CAMS in similar climates (Eissa et al., 2015a, b; Lefèvre et al., 2013; Lefèvre and Wald, 2016; Thomas et al., 2016b). The station at Erfoud is an exception where the McClear scheme overestimates. Tan-Tan is slightly different from the others: the points are well aligned on the 1:1 line, and a slight overestimation may be observed for the greatest clearness indices. The situation is more contrasted for CAMS-Rad. As a whole, an underestimation is observed when KT is less than 0.7 and the greatest clearness indices are well reproduced. Similar to HC3v5, McClear overestimates the greatest clearness indices at Erfoud. The greatest clearness indices are well estimated at Tan-Tan. However, there is a large scattering when KT is less than 0.7 and actual cloudy conditions are often reported as cloud-free by CAMS-Rad.
It has been noted that Tan-Tan is often an exception for all databases. This may relate to its particular location close to the seashore which experiences moisture-laden breezes from the ocean and where many small clouds form which may not be detectable individually in the Meteosat images. The exact performance at this site depends on each database, though HC3v4 and HC3v5 perform fairly similarly. The bias and the RMSE for G and KT are less for HC3v4 and HC3v5 than for CAMS-Rad. On the contrary, for BN, CAMS-Rad exhibits smaller bias and RMSE than HC3v4 and HC3v5.
This paper reports on a comparison of three satellite-derived radiation databases against the measurements of 5 stations in Morocco. A great deal of attention has been paid to the quality of the measurements prior to the comparison.
It was found that the three databases reproduce the hour-to-hour changes in SSI very well with correlation coefficients of around 0.97–0.98 for the global radiation G at all stations. For the direct irradiation BN, the correlation coefficients are around 0.70–0.79 for HC3v4, 0.79–0.84 for HC3v5 and 0.78–0.87 for CAMS-Rad.
HC3v4 and HC3v5 have a tendency to underestimate G in Morocco. The bias relative to the average of the measurements is small and ranges between −1 and −6 % for HC3v4 and 0 and −4 % for HC3v5. It ranges between −4 and 7 % for CAMS-Rad. The RMSE ranges between 53 and 72 Wh m−2 (11 and 13 %) for HC3v4 and HC3v5, and between 59 and 97 Wh m−2 (11 and 21 %) for CAMS-Rad. As for BN, HC3v5 offers the smallest RMSE (153 to 177 Wh m−2), then HC3v4 (170 to 210 Wh m−2), and finally CAMS-Rad (159 to 244 Wh m−2).
It has been observed that the performance of the databases varies from site to site and is not constant. Constant performances are desirable when one wants to compare the solar irradiation between two or more places. HC3v5 does not exhibit noticeable geographical changes in performances; it captures the temporal and spatial variability of the irradiation field well. The performance is worse for HC3v4 and CAMS-Rad which exhibit more geographical variability.
One may observe that CAMS-Rad is not providing much better performances than HC3v4 or HC3v5. The contrary could have been expected as the attenuation of the SSI due to clouds in the HC3v4 and HC3v5 databases is based on the empirical concept of cloud index in the Heliosat-2 method whose design dates back to the end of the 1970s, while in CAMS-Rad it is based on the more recent and more sophisticated APOLLO processing of multispectral images from Meteosat in the Heliosat-4 method. This demonstrates that simplicity does not exclude accuracy. One may recall that Heliosat-2 has been the subject of many investigations and that successive re-processing steps of HC3 aim at correcting errors and refining estimates towards a better accuracy. This is not yet the case of Heliosat-4 which is a recent method that needs to be fully understood for its qualities and drawbacks.
Assuming that the in situ measurements achieve the “moderate quality” pyranometer measurements defined by WMO (2008, rev. 2012) for hourly global irradiation, one may ask if the estimates from the three databases are compliant with “moderate quality”. Defined as the 95 % probability (P95), the relative uncertainty for “moderate quality” should not exceed 20 %. The total uncertainty takes into account the uncertainty of observations and the uncertainty of the estimates. It can be expressed in a first approximation as the quadratic sum of both uncertainties. As a consequence, the total relative uncertainty should not exceed 28 % (P95), or 14 % (P66) if the estimates were of “moderate” quality. The relative RMSE is less than 14 % for HC3v4 and HC3v5 and for CAMS-Rad with the exception of Tan-Tan. It can be concluded that to a first approximation, the quality of the estimates meets the “moderate quality” for all databases. As a whole, the three databases are reliable sources of data on solar radiation over Morocco.
-
HC3v4 and HC3v5 data may be requested by e-mail to Mathilde Marchand (mathilde.marchand@transvalor.com);
-
CAMS Radiation service data are freely available to anyone from the web site SoDa after registration;
-
in-situ measurements data may be requested by e-mail to Abdellatif Ghennioui (ghennioui@iresen.org).
The authors declare that they have no conflict of interest.
This article is part of the special issue “17th EMS Annual Meeting: European Conference for Applied Meteorology and Climatology 2017”. It is a result of the EMS Annual Meeting: European Conference for Applied Meteorology and Climatology 2017, Dublin, Ireland, 4–8 September 2017.
The authors thank the IRESEN for providing measurements of solar radiation.
The authors thank the anonymous reviewer and Yehia Eissa for their questions
and comments which greatly enhance the clarity of the article. The research
leading to these results has been partly undertaken within the Copernicus
Atmosphere Monitoring Service (CAMS) of the European Union.
Edited by: Sven-Erik Gryning
Reviewed by: Yehia Eissa and one anonymous referee
Bell, M. J., Lefebvre, M., Le Traon, P. Y., Smith, N., and Wilmer-Becker, K.: GODAE, The global ocean data assimilation experiment, Oceanography, 22, 14–21, 2009.
Bengulescu, M., Blanc, P., and Wald, L.: On the temporal variability of the surface solar radiation by means of spectral representations, Adv. Sci. Res., 13, 121–127, https://doi.org/10.5194/asr-13-121-2016, 2016.
Bengulescu, M., Blanc, P., and Wald, L.: On the intrinsic time-scales of temporal variability in measurements of the surface solar radiation, Nonlin. Process. Geophys., 25, 19–37, https://doi.org/10.5194/npg-25-19-2018, 2018.
Bengulescu, M., Blanc, P., Boilley, A., and Wald, L.: Do modelled or satellite-based estimates of surface solar irradiance accurately describe its temporal variability?, Adv. Sci. Res., 14, 35–48, https://doi.org/10.5194/asr-14-35-2017, 2017.
Blanc, P. and Wald, L.: The SG2 algorithm for a fast and accurate computation of the position of the Sun, Sol. Energy, 86, 3072–3083, https://doi.org/10.1016/j.solener.2012.07.018, 2012.
Blanc, P., Gschwind, B., Lefèvre, M., and Wald, L.: The HelioClim project: Surface solar irradiance data for climate applications, Remote Sens.-Basel, 3, 343–361, https://doi.org/10.3390/rs3020343, 2011.
Blanc, P., Gschwind, B., Lefèvre, M., and Wald, L.: Twelve monthly maps of ground albedo parameters derived from MODIS data sets, In Proceedings of IGARSS 2014, 13–18 July 2014, Quebec, Canada, 3270–3272, 2014.
Blanc, P., Coulaud, C., and Wald, L.: Yearly changes in surface solar radiation in New Caledonia, Adv. Sci. Res., 12, 1–4, https://doi.org/10.5194/asr-12-1-2015, 2015.
Boilley, A. and Wald L.: Comparison between meteorological re-analyses from ERA-Interim and MERRA and measurements of daily solar irradiation at surface, Renew. Energ., 75, 135–143, https://doi.org/10.1016/j.renene.2014.09.042, 2015.
Bois, B., Pieri, P., Van Leeuwen, C., Wald, L., Huard, F., Gaudillere, J.-P., and Saur, E.: Using remotely sensed solar radiation data for reference evapotranspiration estimation at a daily time step, Agr. Forest Meteorol., 148, 619–630, 2008.
Cano, D., Monget, J. M., Albuisson, M., Guillard, H., Regas, N., and Wald, L.: A method for the determination of the global solar radiation from meteorological satellites data, Sol. Energy, 37, 31–39, 1986.
Colombo, R., Busetto, L., Migliavacca, M., Meroni, M., Della Torre, C., Tagliaferri, A., Grassi, G., and Seufert, G.: Modelling carbon cycle of agro-forest ecosystems in Lombardy (Italy), Forest, 6, 277–288, 2009.
Cros, S., Albuisson, M., and Wald, L.: Simulating Meteosat-7 broadband radiances at high temporal resolution using two visible channels of Meteosat-8, Sol. Energy, 80, 361–367, https://doi.org/10.1016/j.solener.2005.01.012, 2006.
Eissa, Y., Korany, M., Aoun, Y., Boraiy, M., Abdel Wahab, M., Alfaro, S., Blanc, P., El-Metwally, M., Ghedira, H., and Wald, L.: Validation of the surface downwelling solar irradiance estimates of the HelioClim-3 database in Egypt, Remote Sens.-Basel, 7, 9269–9291, https://doi.org/10.3390/rs70709269, 2015a.
Eissa, Y., Munawwar, S., Oumbe, A., Blanc, P., Ghedira, H., Wald, L., Bru, H., and Goffe, D.: Validating surface downwelling solar irradiances estimated by the McClear model under cloud-free skies in the United Arab Emirates, Sol. Energy, 114, 17–31, https://doi.org/10.1016/j.solener.2015.01.017, 2015b.
Espinar, B., Ramírez, L., Polo, J., Zarzalejo, L. F., and Wald, L.: Analysis of the influences of uncertainties in input variables on the outcomes of the Heliosat-2 method, Sol. Energy, 83, 1731–1741, https://doi.org/10.1016/j.solener.2009.06.010, 2009.
Greif, J. J., Scharmer, K., Aguiar, R., Albuisson, M., Beyer, H.-G., Borisenkov, E. P., Bourges, B., Czeplak, G., Lund, H., Joukoff, A., Page, J. K., Terzenbach, U., and Wald, L.: The European Solar Radiation Atlas: Database, Models and Exploitation Software, in: Vol. 2, Presse des Mines, Paris, France, p. 290, 2000.
Gschwind, B., Ménard, L., Albuisson, M., and Wald, L.: Converting a successful research project into a sustainable service: the case of the SoDa Web service, Environ. Model. Softw., 21, 1555–1561, https://doi.org/10.1016/j.envsoft.2006.05.002, 2006.
ISO Guide to the Expression of Uncertainty in Measurement: first edition, International Organization for Standardization, Geneva, Switzerland, 1995.
Juzeniene, A., Brekke, P., Dahlback, A., Andersson–Engels, S., Reichrath, J., Moan, K., Holick, M. F., Grant, W. B., and Moan, J.: Solar radiation and human health, Rep. Prog. Phys., 74, 066701, https://doi.org/10.1088/0034-4885/74/6/066701, 2011.
Korany, M., Boraiy, M., Eissa, Y., Aoun, Y., Abdel Wahab, M. M., Alfaro, S. C., Blanc, P., El-Metwally, M., Ghedira, H., Hungershoefer, K., and Wald, L.: A database of multi-year (2004–2010) quality-assured surface solar hourly irradiation measurements for the Egyptian territory, Earth Syst. Sci. Data, 8, 105–113, https://doi.org/10.5194/essd-8-105-2016, 2016.
Lefèvre, M. and Wald, L.: Validation of the McClear clear-sky model in desert conditions with three stations in Israel, Adv. Sci. Res., 13, 21–26, https://doi.org/10.5194/asr-13-21-2016, 2016.
Lefèvre, M., Diabaté, L., and Wald, L.: Using reduced data sets ISCCP-B2 from the Meteosat satellites to assess surface solar irradiance, Sol. Energy, 81, 240–253, 2007.
Lefèvre, M., Oumbe, A., Blanc, P., Espinar, B., Gschwind, B., Qu, Z., Wald, L., Schroedter-Homscheidt, M., Hoyer-Klick, C., Arola, A., Benedetti, A., Kaiser, J. W., and Morcrette, J.-J.: McClear: a new model estimating downwelling solar radiation at ground level in clear-sky conditions, Atmos. Meas. Tech., 6, 2403–2418, https://doi.org/10.5194/amt-6-2403-2013, 2013.
Lefèvre, M., Blanc, P., Espinar, B., Gschwind, B., Ménard, L., Ranchin, T., Wald, L., Saboret, L., Thomas, C., and Wey, E.: The HelioClim-1 database of daily solar radiation at Earth surface: an example of the benefits of GEOSS Data-CORE, IEEE J.-STARS, 7, 1745–1753, https://doi.org/10.1109/JSTARS.2013.2283791, 2014.
Marchand, M., Al-Azri, N., Ombe-Ndeffotsing, A., Wey, E., and Wald, L.: Evaluating meso-scale change in performance of several databases of hourly surface irradiation in South-eastern Arabic Pensinsula, Adv. Sci. Res., 14, 7–15, https://doi.org/10.5194/asr-14-7-2017, 2017.
Oumbe, A., Qu, Z., Blanc, P., Lefèvre, M., Wald, L., and Cros, S.: Decoupling the effects of clear atmosphere and clouds to simplify calculations of the broadband solar irradiance at ground level, Geosci. Model Dev., 7, 1661–1669, https://doi.org/10.5194/gmd-7-1661-2014, 2014.
Page, J., Albuisson, M., and Wald, L.: The European solar radiation atlas: a valuable digital tool, Sol. Energy, 71, 81–83, https://doi.org/10.1016/S0038-092X(00)00157-2, 2001.
Peel, M. C., Finlayson, B. L., and McMahon, T. A.: Updated world map of the Köppen–Geiger climate classification, Hydrol. Earth Syst. Sci., 11, 1633–1644, https://doi.org/10.5194/hess-11-1633-2007, 2007.
Qu, Z., Gschwind, B., Lefevre, M., and Wald, L.: Improving HelioClim-3 estimates of surface solar irradiance using the McClear clear-sky model and recent advances in atmosphere composition, Atmos. Meas. Tech., 7, 3927–3933, https://doi.org/10.5194/amt-7-3927-2014, 2014.
Qu, Z., Oumbe, A., Blanc, P., Espinar, B., Gesell, G., Gschwind, B., Klüser, L., Lefèvre, M., Saboret, L., Schroedter-Homscheidt, M., and Wald, L.: Fast radiative transfer parameterisation for assessing the surface solar irradiance: The Heliosat-4 method, Meteorol. Z., 26, 33–57, https://doi.org/10.1127/metz/2016/0781, 2017.
Rigollier, C., Bauer, O., and Wald, L.: On the clear sky model of the ESRA – European Solar Radiation Atlas – with respect to the Heliosat method, Sol. Energy, 68, 33–48, https://doi.org/10.1016/S0038-092X(99)00055-9, 2000.
Rigollier, C., Lefèvre, M., and Wald, L.: The method Heliosat-2 for deriving shortwave solar radiation from satellite images, Sol. Energy, 77, 159–169, https://doi.org/10.1016/j.solener.2004.04.017, 2004.
Ruiz-Arias, J. A.: Modelization of the terrain morphology influence on the solar radiation field at the Earth's surface, PhD, Thesis (eq. 4.34), University of Jaen, Jaen, Spain, p. 202, 2009.
Schüler, D, Wilbert, S., Geuder, N., Affolter, R., Wolfertstetter, F., Prahl, C., Röger, M., Schroedter-Homscheidt, M., Abdellatif, G., Allah Guizani, A., Balghouthi, M., Khalil, A., Mezrhab, A., Al-Salaymeh, A., Yassaa, N., Chellali, F., Draou, D., Blanc,P., Dubranna, J., and Sabry, O. M. K.: The enerMENA meteorological network – Solar radiation measurements in the MENA region, AIP Conf. Proc., 1734, id.150008, https://doi.org/10.1063/1.4949240, 2016.
Thomas, C., Wey, E., Blanc, P., and Wald, L.: Validation of three satellite-derived databases of surface solar radiation using measurements performed at 42 stations in Brazil, Adv. Sci. Res., 13, 129–136, https://doi.org/10.5194/asr-13-129-2016, 2016a.
Thomas, C., Wey, E., Blanc, P., Wald, L., and Lefèvre, M.: Validation of HelioClim-3 version 4, HelioClim-3 version 5 and MACC-RAD using 14 BSRN stations, 2015 Solar Heating and Cooling, Energy Proced., 91, 1059–1069, 2016b.
Trolliet, M., Walawender, J.P., Bourlès, B., Boilley, A., Trentmann, J., Blanc, P., Lefèvre, M., and Wald, L.: Estimating downwelling solar irradiance at the surface of the tropical Atlantic Ocean: A comparison of PIRATA measurements against several re-analyses and satellite-derived data sets, Ocean Sci. Discuss., https://doi.org/10.5194/os-2017-95, in review, 2017.
Wagner, R., Marxsen, J., Zwick, P., and Cox, E. J.: Central European Stream Ecosystems: The Long Term Study of the Breitenbach, Wiley, New York, NY, USA, 2012.
Wahab, A. M., El-Metwally, M., Hassan, R., Lefèvre, M., Oumbe, A., and Wald, L.: Assessing surface solar irradiance in Northern Africa desert climate and its long-term variations from Meteosat images, Int. J. Remote Sens., 31, 261–280, 2009.
WMO: Technical Note No. 172, WMO-No. 554, World Meteorological Organization, Geneva, Switzerland, 121–123, 1981.
WMO: Guide to Meteorological Instruments and Methods of Observation, WMO-No. 8, 7th Edn. 2008, (rev. 2012), World Meteorological Organization, Geneva, Switzerland, 2008.
- Abstract
- Introduction
- Description of measurements used for comparison and quality control
- The Meteosat satellites, the HelioClim databases and the CAMS Radiation Service
- Validation against in-situ measurements
- Results and discussion
- Conclusions and perspectives
- Data availability
- Competing interests
- Special issue statement
- Acknowledgements
- References