 | 01 Aug 2018
1845–2016 gridded dataset of monthly precipitation over the upper Adda river basin: a comparison with runoff series
Alice Crespi
Michele Brunetti
Maurizio Maugeri
Roberto Ranzi
Massimo Tomirotti
A new high-resolution gridded dataset of 1845–2016 monthly precipitation series for the upper Adda river basin was computed starting from a network of high-quality and homogenised station records covering Adda basin and neighbouring areas and spanning more than two centuries. The long-term signal was reconstructed by a procedure based on the anomaly method and consisting in the superimposition of two fields which were computed independently: 1961–1990 monthly climatologies and gridded anomalies. Model accuracy was evaluated by means of station series reconstruction in leave-one-out approach and monthly relative mean absolute errors were found to range between 14 % in summer and 24 % in winter. Except for the period before the 1870s when station coverage is rather low, reconstruction errors are quite stable. The 1845–2016 monthly areal precipitation series integrated over Adda basin was finally computed. The robustness of this series was evaluated and it was investigated for long-term trend. While no significant trend emerged for precipitation, the analysis performed on 1845–2016 annual runoff values recorded at Lake Como outlet highlighted a negative trend. Runoff decrease is supposed to be mostly due to an increasing role of evapotranspiration linked to temperature increase, which is only partially compensated by the increase in glacier melting rate. In order to test the applicability of the gridded database for the reconstruction of extreme past events, the episode with the highest precipitation in Adda basin series (November 2002) was considered and the corresponding gridded fields of monthly anomalies and precipitation values were evaluated both with actual station density and with station densities corresponding to 1922 and 1882. Even considering 1882 station density, the main spatial patterns are well depicted proving the suitability of anomaly method to deal also with sparse station networks.


The availability of long-term observational series of meteorological variables is crucial to study the evolution of past climate and to detect climate variability and change. Projecting climate normals onto high-resolution grids covering specific regions of interest allows to complete the information about temporal variability deriving from the secular sparse station networks and to extract long-term series in absolute values for any point of the study area. These gridded datasets provide a very useful tool to investigate more accurately possible changes in the climatic variables, to perform areal trend analyses and to support climate change impact studies. In particular, at basin scale gridded precipitation can be combined with hydrological data to derive relevant information about interconnections occurring among climate, natural environment and human activities as well as about their changes over time.
Several observational gridded precipitation datasets covering the pan-Alpine region have been recently produced at different spatial and time resolutions, such as the 10 min resolution monthly dataset proposed by Efthymiadis at al. (2006) for the 1800–2003 period, the 1970–2008 daily dataset at 5 km resolution described in Isotta et al. (2014) and the most recent 1901–2008 monthly precipitation dataset presented by Masson and Frei (2016) with a grid-spacing of 5 km. One of the methodologies which have been currently applied to interpolate station network observations onto high-resolution grid is based on the so-called “anomaly method” (e.g. New et al., 2000; Mitchell and Jones, 2005) whose main assumption is that any climatic signal can be described by the superimposition of a spatial field of normal values for a certain reference period (i.e. the climatologies), and a spatio-temporal field of anomalies from them. The two fields can be computed separately thanks to their different features. Climatologies are strictly linked to orography and require a dense data coverage as well as interpolation models taking into account the spatial variability of the rainfall-orography relationship, while anomalies, which exhibit higher spatial coherence, can be computed starting from a less dense database but providing long and homogeneous time series properly covering the entire study period. Homogeneity and good quality of data are mandatory to avoid non-climatic signals to affect the long-term anomaly reconstruction.
We are currently working on the application of this methodology to produce a gridded monthly precipitation dataset for an area centred on the upper part of Adda river basin and including neighbouring regions (8.8–10.7∘ E and 45.6–46.7∘ N, the blue box in Fig. 1). Adda river is one of the main left-side tributaries of Po river, its upper catchment covers about 4508 km2 and it is located in Northern Italy, and to a lesser extent in Switzerland, over an area characterised by a great orographic complexity. The upper part of Adda river basin is a very interesting area both because it is surrounded by a relevant number of secular precipitation records and because it has an uninterrupted runoff daily record starting from 1845, which was recently recovered (Ranzi et al., 2017). Our goal is to obtain a secular precipitation record for any point of a 30 arcsec resolution grid (∼ 1 km) covering this region which could be investigated in trend analysis and compared to hydrological data. The resulting dataset represents an update and improvement of already existing monthly fields for the region since it is constructed by considering a rain-gauge database including newly digitised data relative to Adda basin, or close sites, and most series updated to the most recent period. In this paper, we present the data and the applied methods and we show some preliminary analyses highlighting the potential of the gridded dataset of secular precipitation records.
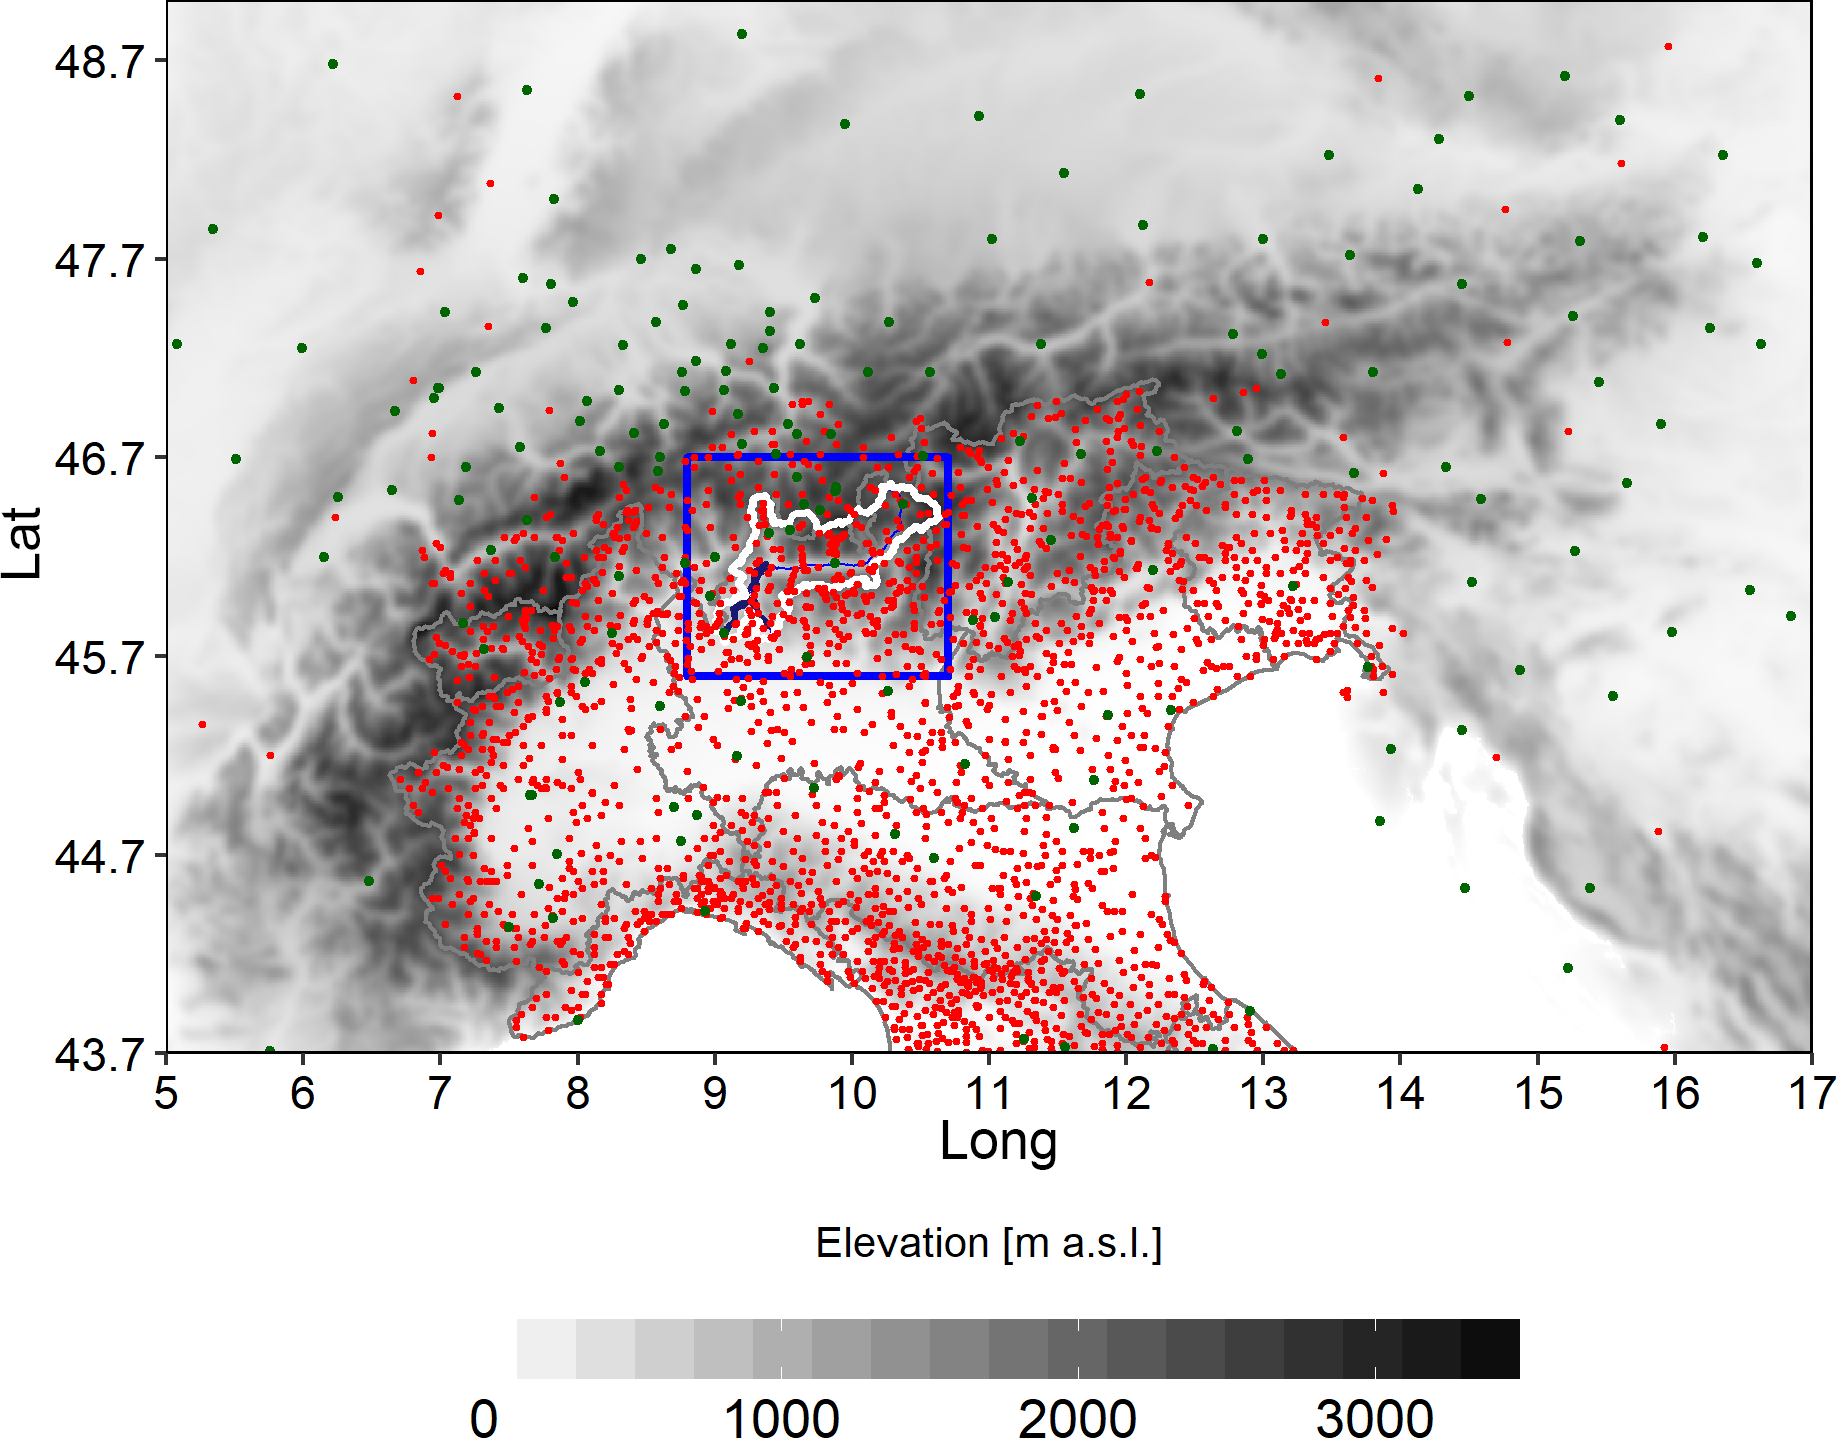
Figure 1Distribution of the available monthly precipitation series. Study domain is contained in the blue square where the upper Adda river basin area is bordered in white. Green dots represent the stations with the longest records (more than 120 years of data).
2.1 Data and Study area
The database we used to compute the secular monthly precipitation records for the upper part of Adda river basin is composed by more than 2500 precipitation series located over a wide region extending over Central-Northern Italy (latitude above 43.7∘ N) and surrounding countries as shown in Fig. 1. This very large area is considered to fully exploit available precipitation records in the early period when there are no data from stations located within the blue box region (Fig. 1). Data were retrieved from both daily and monthly archives of several national and international sources. The main data providers were Regional Agency for Environmental Protection (ARPA) and Geological Monitoring Service (CMG) in Lombardy, MeteoTrentino for Autonomous Province of Trento, Autonomous Province of Bozen, MeteoSwiss and the former National Hydrographic Service for the most ancient data. Moreover, these data were integrated by those included in databases available from previous works, such as Brunetti et al. (2006), Auer et al. (2007), Brugnara et al. (2012) and Crespi et al. (2018). Data collection was focused both on maximising the spatial coverage over the study domain and closer areas, especially where strong orographic gradients occur, and on increasing the availability of long and homogeneous precipitation series over the entire considered period. At this aim, precipitation data collected by the recent automatic weather station networks were recovered and integrated to those from the mechanical ones, and the most ancient data for some Italian records were digitised from hardcopy historical archives (Servizio Idrografico, 1920, 1957). Except for the series which were retrieved from already homogenised and quality-checked archives, all monthly precipitation series underwent a quality-check procedure (for details see Crespi et al., 2018) aiming at removing spurious records or digitisation oversights and at detecting the presence of relevant inhomogeneous periods. In addition, the longest records showing possible breaks during quality-check activity were considered for homogenisation by applying a procedure based on Craddock test (Craddock, 1979). 125 monthly series, 57 of which located inside the study domain, of an average length of 85 years were homogenised by identifying more than 300 breaks. The applied corrections lead to an overall decrease in reconstruction errors for homogenised series of about 10 % in comparison with those obtained by considering original versions.
The resulting database covers more than two centuries from 1750 to 2016 and 338 series are located inside the study domain. Here we consider however only the 1845–2016 period. While spatial distribution of stations over Adda basin is relatively dense (about one station per 44 km2), the corresponding data availability is highly variable over the study period and no stations have data before 1873 (dashed line in Fig. 2). However, the inclusion of outer stations with available data in the most ancient years allows to extend the computation of precipitation fields over Adda basin back in the past and to improve the robustness of reconstructed values for the earliest period. These stations, especially the ones at the greatest distance from the basin, do not influence the reconstruction over decades of dense data coverage on the study domain and they mostly contribute for the first decades of the study period. In fact, the availability of records in the past is very good if we focus on the entire area in Fig. 1 (solid line in Fig. 2). From 1750 to the first half of the 19th century the number of active stations gradually increases reaching about 50 observation sites. Since the second half of the 19th century this increase is more evident until 1921 when more than 600 sites were operating thanks to the contribution of the new meteorological network managed by Italian Hydrographic Service. After the negative consequences of the Second World War on the management of station sites, data availability reaches its maximum from 1951 to the last decades of the 20th century with more than 1500 series. Over recent years, the decrease in station availability is largely due to the fragmentation of Italian meteorological network under regional and sub-regional managements together with a general disposal of mechanical stations which in some cases were not substituted by the automatic ones. The database contains 9 series with more than 200 years of data, 31 series with more than 160 years and 120 series more than 120 years long, 14 out of these located within the study domain (blue box in Fig. 1). However, no one of these 14 stations has data before 1861. Looking at the variation in mean inter-station distance (i.e. the distance between each station and the closest one) over the whole period, we could retrieve further information about the development in data coverage and the spatial scales that can be effectively resolved in reconstruction analysis. The mean inter-station distance decreases gradually from ∼ 75 km (30 stations over the whole area) in 1845 to ∼ 25 km in 1900 when 276 stations are available (25 out of them located inside the study area). Its value reduces further during the 20th century and it is about 8 km during the period of maximum station availability (1951–2000).
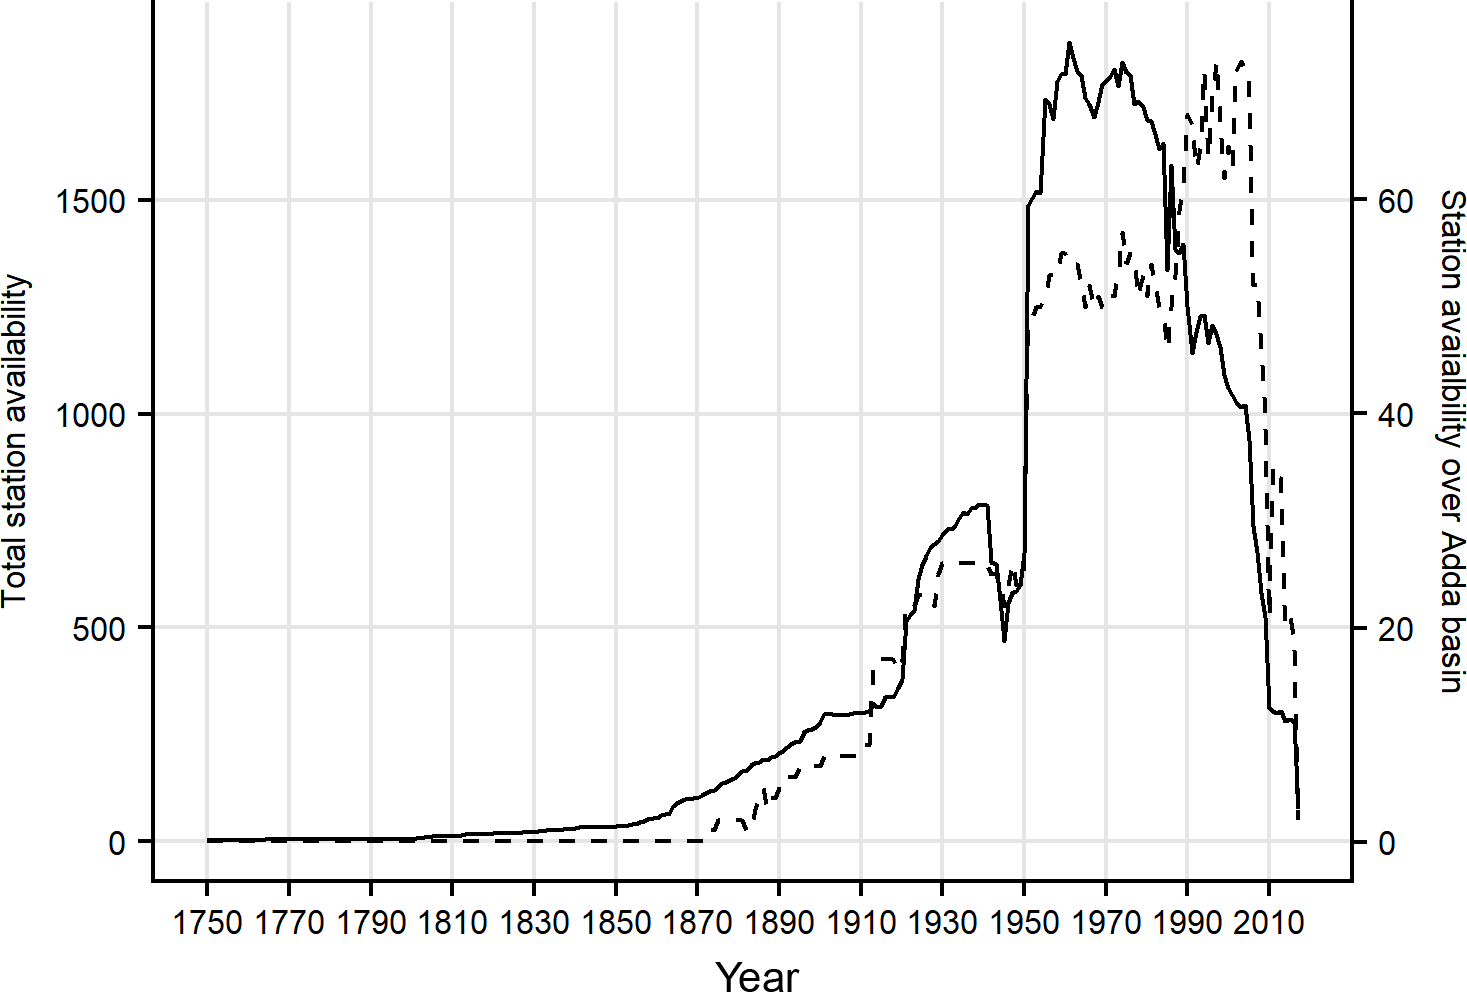
Figure 2Availability of monthly precipitation records over the whole period spanned by the database considering all stations (solid line) and only stations located inside upper Adda river catchment (dashed line).
As regards runoff, 1845–2016 monthly record for the station of Fortilizio at Lake Como outlet was reconstructed from data provided by Adda River Authority and National Hydrographic Service or digitised from historical hardcopy and it is the result of a procedure of merging and correction of data collecting at different stations. In particular, the sub-periods 1845–1922, 1931–1934 and 1944–1945 were derived from Malpensata and Malgrate water level gauges by applying a linear relationship computed on the basis of available overlapping periods with Fortilizio series. Moreover, since 1946, when a new dam in Olginate started lake regulation, runoff values at Fortilizio were derived from the daily series of Lavello station, located downstream of the dam and having runoff data in common with Fortilizio for the period 1946–1950. Thanks to this activity of data recover, a very long and uninterrupted record of runoff for the upper part of Adda river basin is now available for both climatological studies, as discussed in the present work, and operative purposes as decisional support tool in the management of lake regulation. Further details on the reconstruction and analysis of outflows and water levels at Fortilizio station can be retrieved in Ranzi et al. (2017, 2018).
2.2 The anomaly method: gridding climatologies and anomalies
The first step of the anomaly method is the calculation of the station monthly normals that we estimated for the 1961–1990 period as it corresponds to the best data availability of our database. However, since a relevant fraction of stations has missing data in 1961–1990 (about 40 % of stations in the study area have no more than 50 % of available data in this period), before computing their 1961–1990 monthly normals, series were subjected to the gap filling procedure presented in Crespi et al. (2018). Station normals are then used both to transform the station records into anomaly records and as input data for the model applied to get the 30 arcsec monthly precipitation climatologies. Monthly climatological fields are obtained, as described in Crespi et al. (2018), for a smoothed version of 30 arcsec resolution digital elevation model by means of a Local Weighted Linear Regression (LWLR) of precipitation versus elevation applied at each grid cell:
where h(x,y) is cell elevation and a(x,y) and b(x,y) are the regression coefficients estimated at grid point. The precipitation-elevation relationship at each cell is defined by means of a weighted linear regression applied on neighbouring stations. In fact, in order to prioritise stations which are mostly representative of orographic conditions of target location, they enter in the regression with weights depending on their nearness and orographic similarity (elevation, slope steepness, slope orientation and sea distance) to the grid cell. More precisely, the weights are expressed as the product of Gaussian functions, one per geographical feature (par):
whose decreasing rate cpar is optimally defined for each grid point and month by means of a minimisation procedure of model errors. This approach is based on the assumption that precipitation distribution is strongly influenced by the orographic features of the domain, especially elevation, and that this link could vary along the year and at a very local level (Daly et al., 1994, 2002). It is therefore supposed to be suitable to handle with complex domains such as Adda river basin, where remarkable orographic gradients occur.
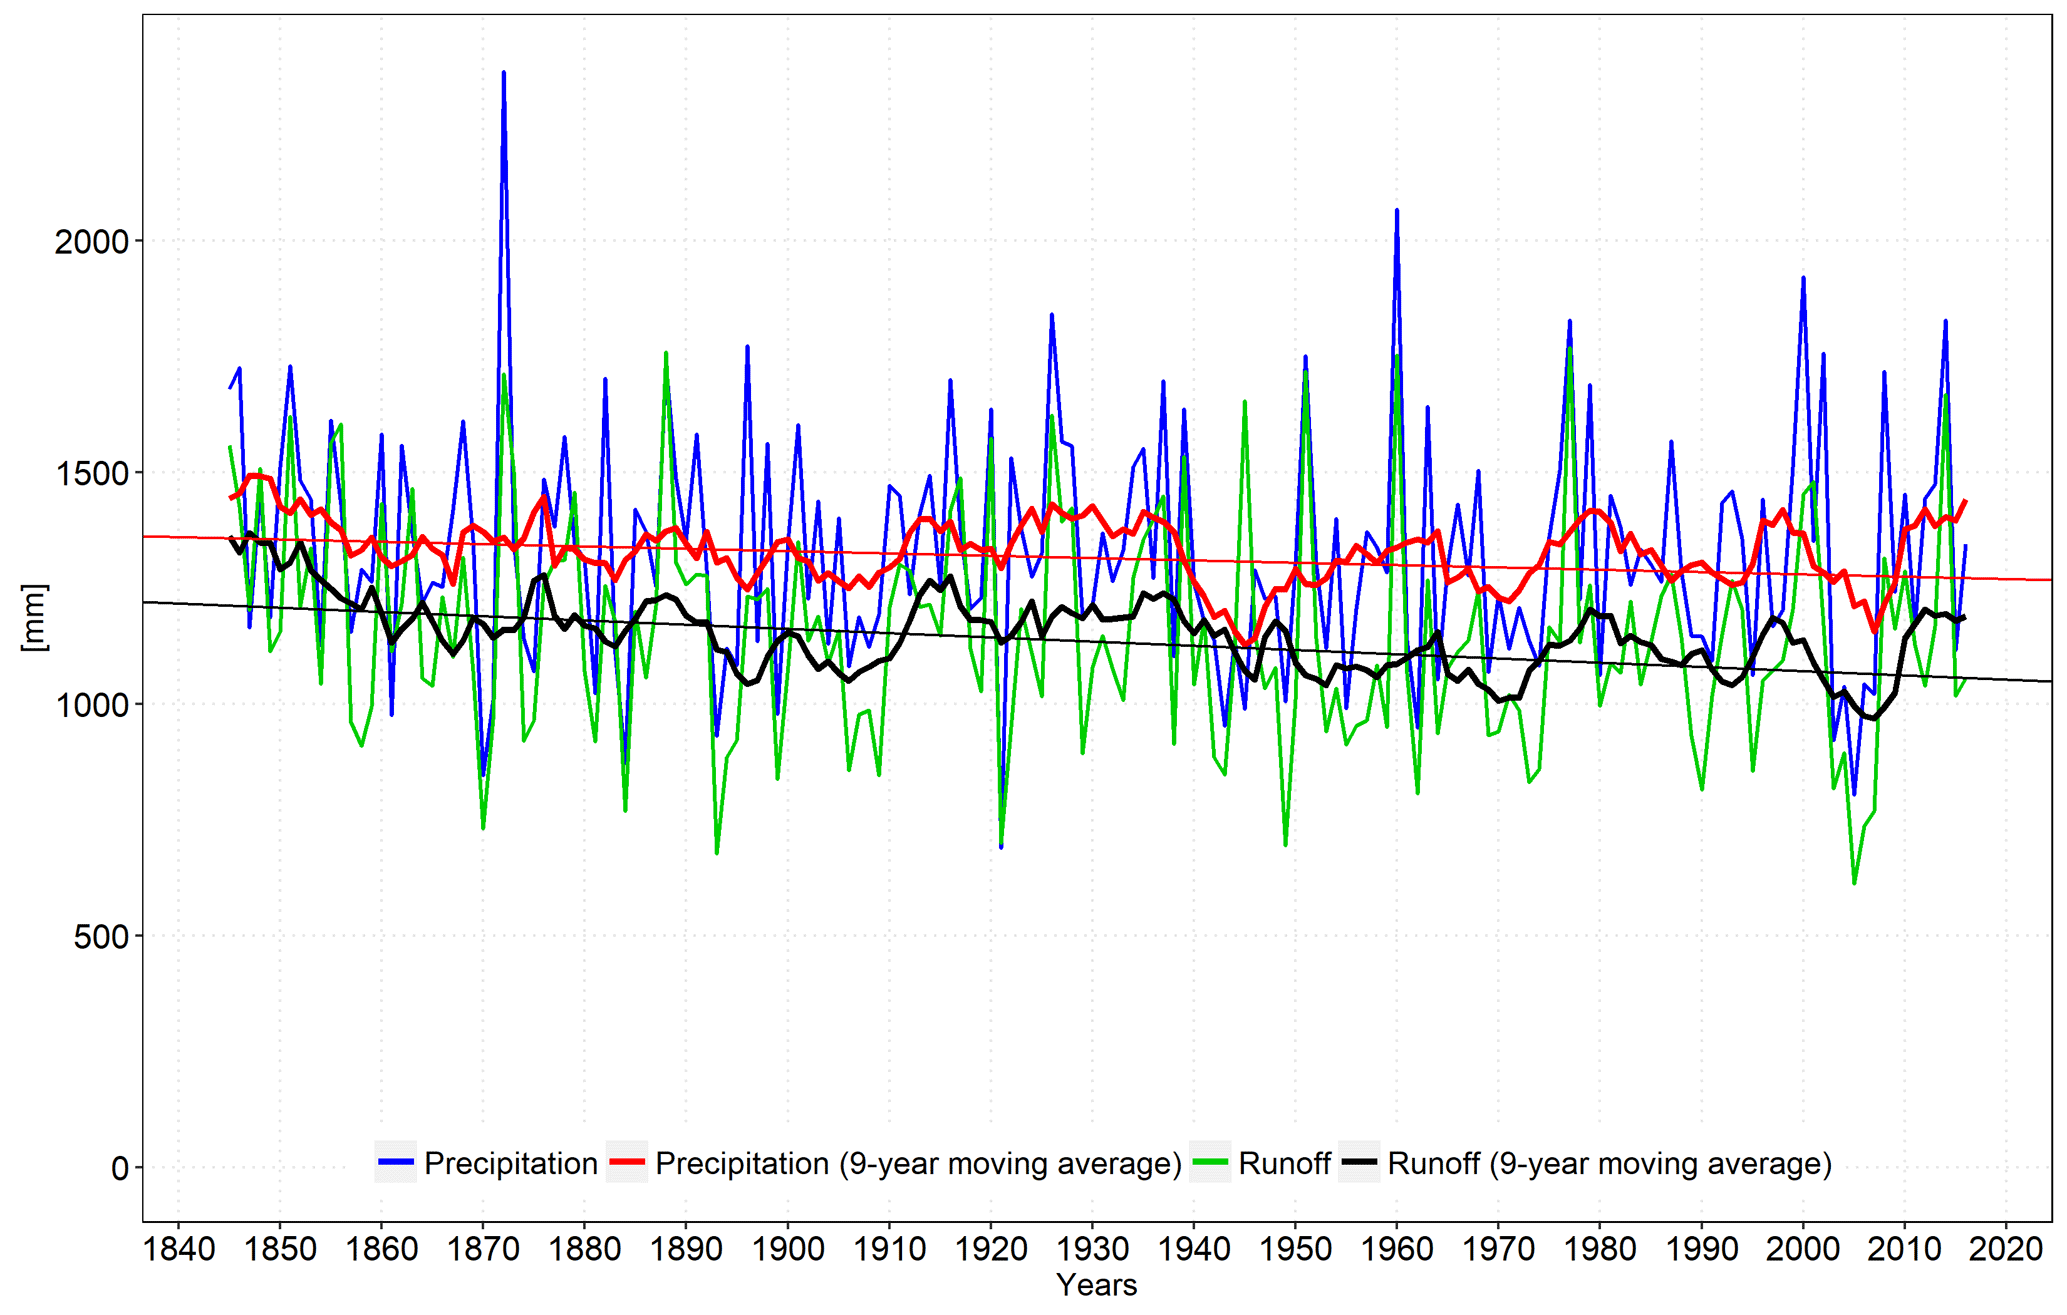
Figure 31845–2016 total annual precipitation (blue line) and annual runoff (green line) records for upper Adda river catchment together with estimated Theil-Sen trends (red and black straight lines). Annual cumulates are computed considering solar year.
1845–2016 station monthly anomaly records, which are defined as the ratio of absolute values to the corresponding monthly normals, are then projected onto the same grid points by means of a weighted average of neighbouring stations. Station weights are in the form of Eq. (2) and they take into account distance and elevation difference from the grid cell. The decrease of distance weight is regulated year by year accordingly to the variation in data density over the reconstructed period. More precisely, for each year the halving distance of weight is set to the mean grid radius containing at least three valid station measurements. This procedure allows to use the fine-scale information available for periods of dense station coverage and to exploit also the data available from distant stations when data availability gets lower.
Finally, gridded anomalies and climatologies are superimposed by their product to obtain the 1845–2016 gridded dataset of monthly precipitation records in absolute values covering the whole upper Adda river basin.
Robustness of climatology and anomaly models was assessed by reconstructing station monthly normals and anomaly series in leave-one-out approach (LOO), i.e. by excluding the station under reconstruction in order to avoid self-influence, and comparing them to measured values. All the 338 stations within the study domain are considered as validation subset. LOO evaluation was however possible only since 1861 because there are no stations inside the considered area before this year. Relative Mean Absolute Error (MAE) for the reconstruction of station anomaly series was found to range, as monthly average, between 14 % in summer and 24 % in winter, whereas the mean common variance between observed and reconstructed series turned out to be 0.86. The time evolution of MAE, evaluated year by year over all reconstructed stations, presents higher and more unstable values in the beginning period, when network is sparser and few validation stations are available. However the error turns out to decrease rapidly after the 1870s and it remains quite constant around 20 % over the rest of the spanned period (figure not shown).
One of the most interesting applications of the dataset of high-resolution gridded precipitation records we obtained for the upper part of Adda river catchment is the reconstruction of an areal series of monthly precipitation from 1845 to 2016, obtained integrating precipitation over the catchment domain. This series provides the total amount of precipitation falling into the catchment area at any time step, information not available using the original sparse station data without applying the interpolation procedure. In order to evaluate the effects of the variability in station coverage on the robustness of this series, we took as reference the precipitation estimates for 1951–2000 period, which corresponds to the years with the highest data density, and we iteratively reconstructed them by varying station availability. More precisely, 1951–2000 areal precipitation record was iteratively evaluated by using only the available data in each 5-year subsequent period from 1846 to 1950. All the simulated annual records show a remarkable agreement with reference series and correlation value rapidly increases from 0.72 when the first 5-year availability is considered (1846–1850) to more than 0.9 using the available stations after 1860.
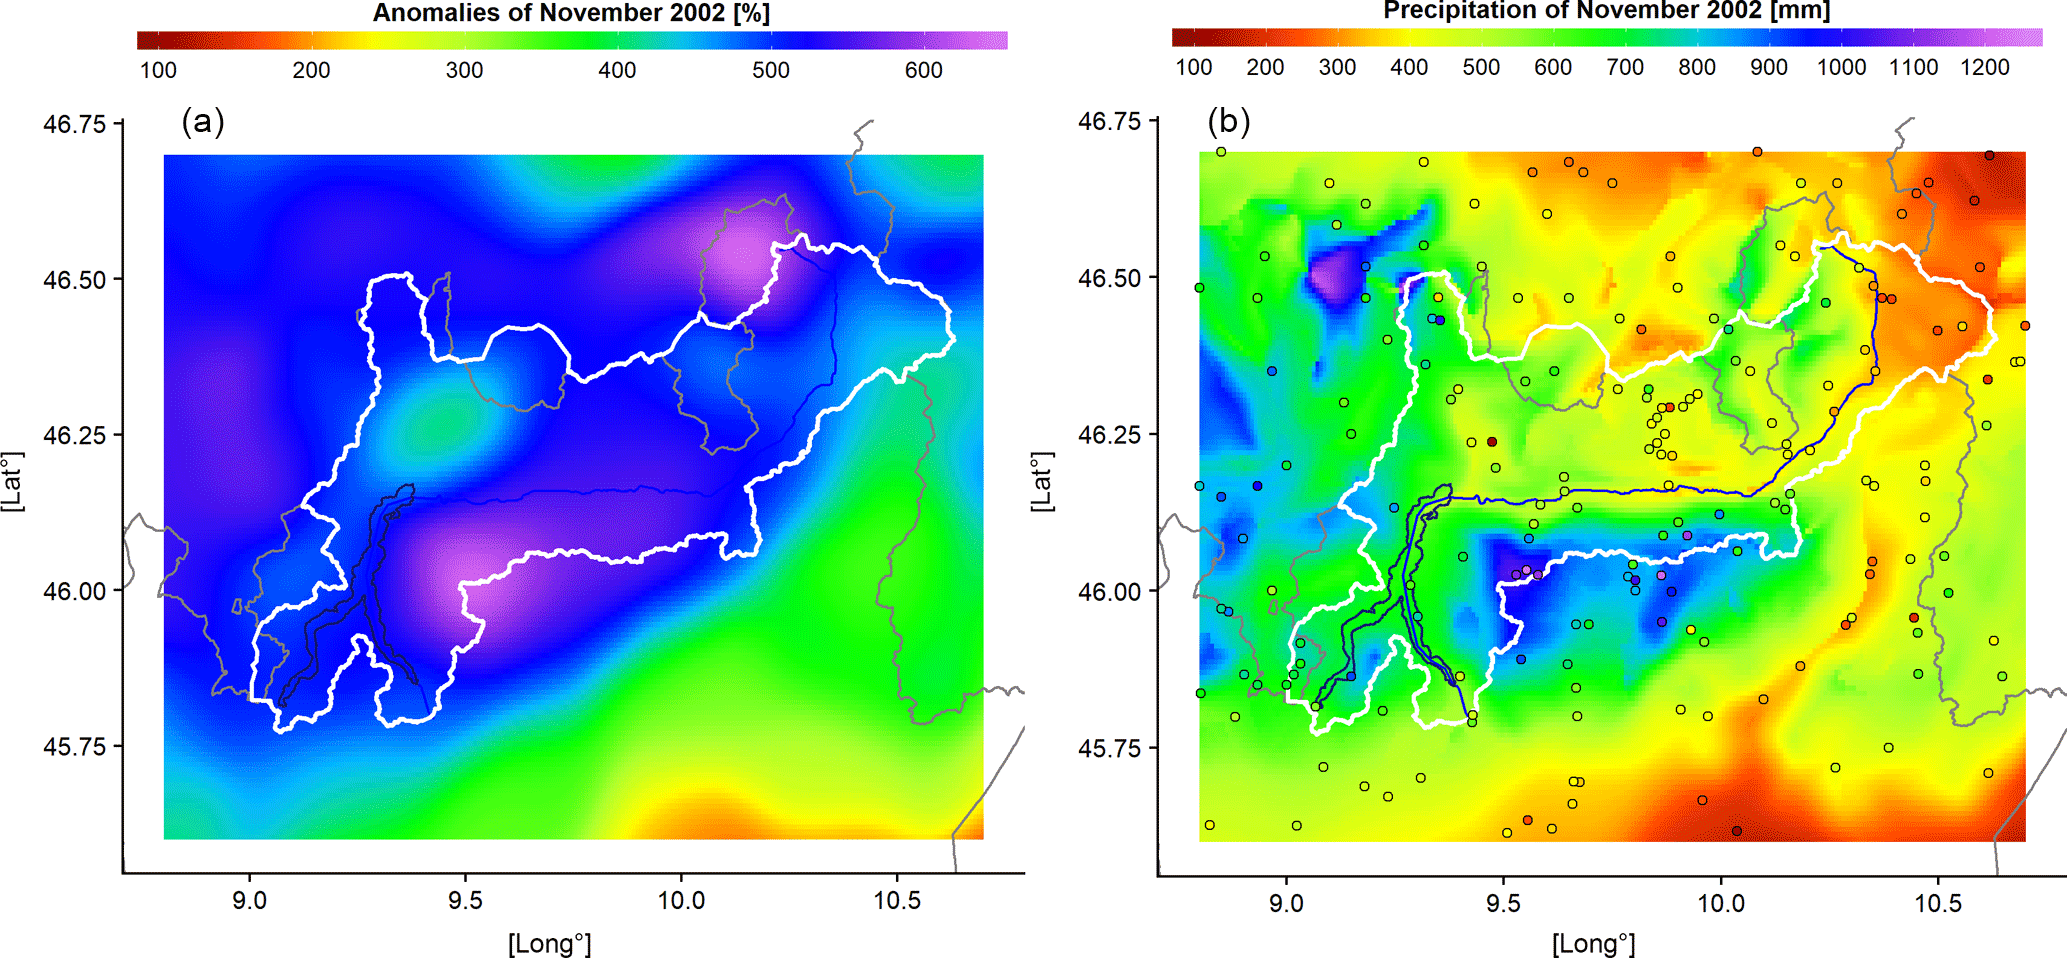
Figure 4Monthly anomaly and precipitation distribution over the domain in November 2002. Points on the second panel represent station locations with available data and they are coloured in accordance to measured precipitation.
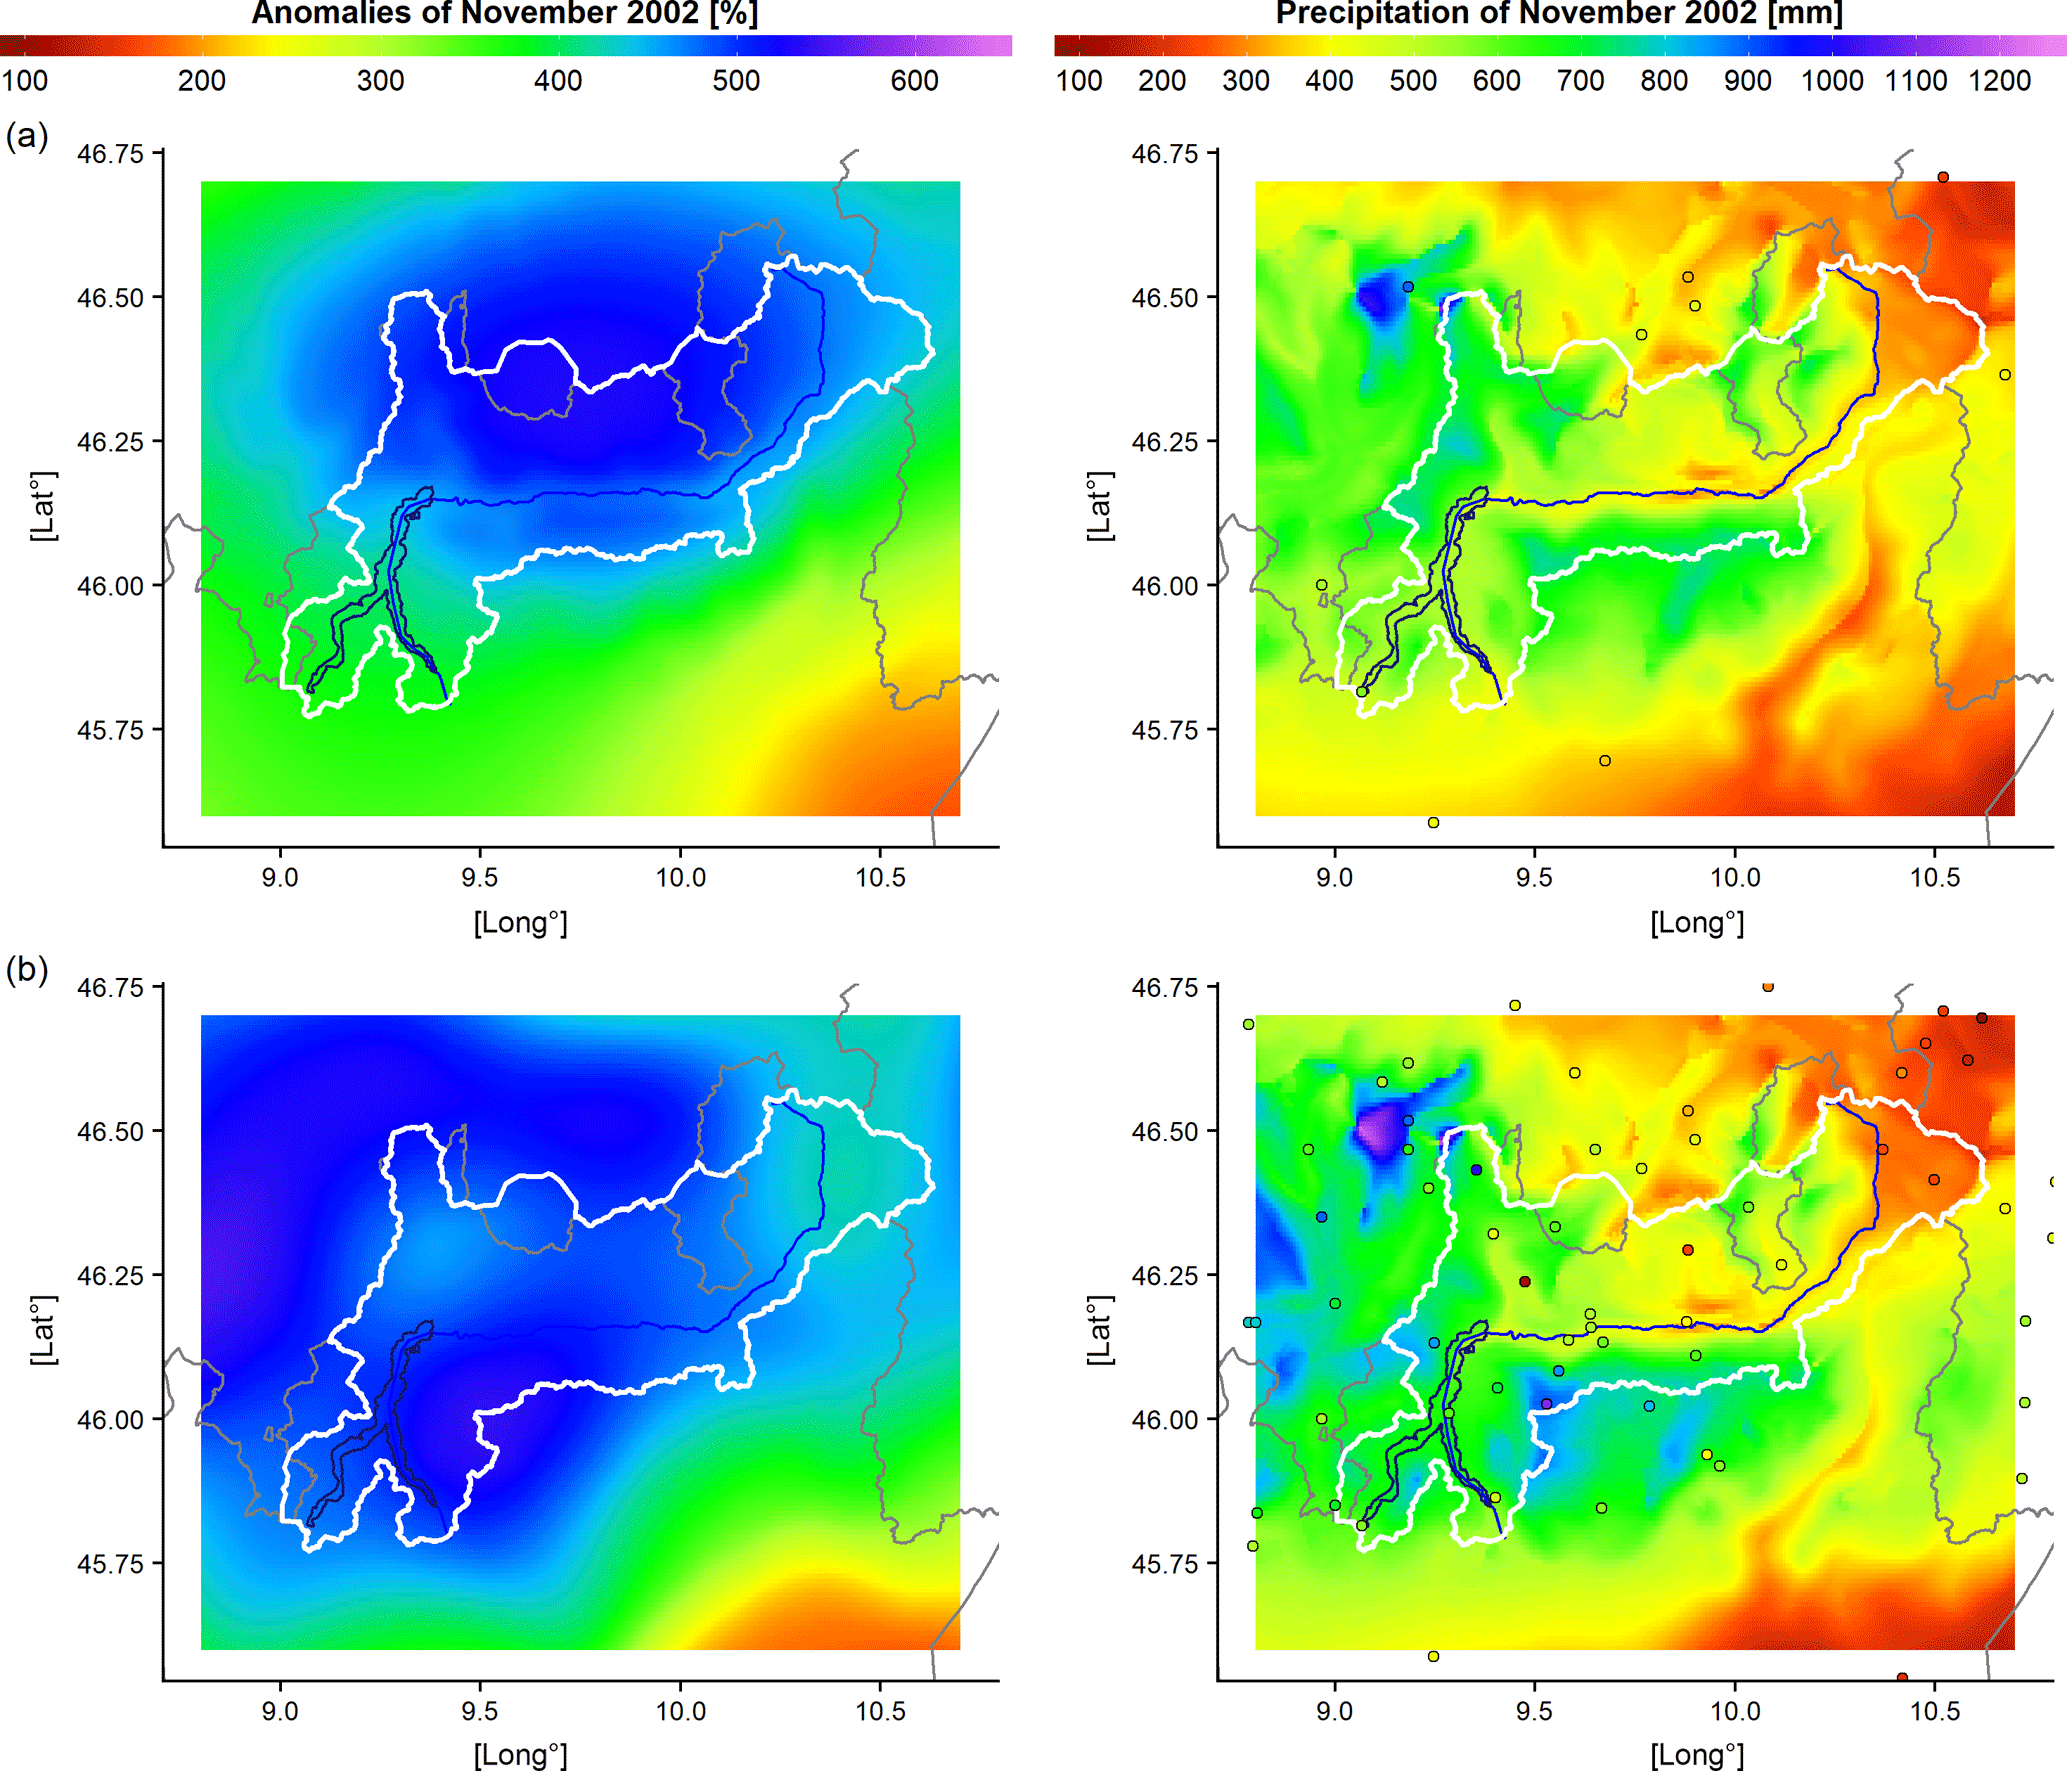
Figure 5Monthly anomaly and precipitation distribution over the domain in November 2002 obtained by considering station availability in (a) 1882 and (b) 1922. Points represent station locations with available data and they are coloured in accordance to measured precipitation.
Considering solar year, annual cumulated values of 1845–2016 areal precipitation series are here presented in Fig. 3, together with the corresponding yearly runoff values at Lake Como outlet, spanning the same period and referring to the same domain. Looking at Fig. 3, the evolution of the two variables over the reconstructed period shows a great agreement and the correlation value between their annual records over the whole period is 0.79 suggesting the robustness of the independently reconstructed datasets.
Both catchment precipitation and runoff yearly records were subjected to trend analysis by means of Theil-Sen test and Mann-Kendall estimator in order to assess and quantify slopes and statistical significances of precipitation and runoff trends over 1845–2016 period. Setting significance level to 0.05, a negative but not statistically significant trend was found for precipitation record with a Theil-Sen slope of −5.1 mm decade−1, while a negative statistically significant tendency was pointed out for runoff with a Theil-Sen slope of −9.2 mm decade−1. We considered also the series of annual runoff to precipitation ratio for which a significant negative trend was found with a decrease of about 0.04 % per year. The different behaviour of precipitation and runoff can be possibly explained arguing an increase of evapotranspiration losses due to the temperature increase, only partially compensated by an increasing rate in glacier melting. However, other not negligible factors could be ascribed as possible causes of the significant decline of runoff from 1845 to date. In particular, the growth of forest coverage occurred in the last decades over the region and due to natural afforestation, as discussed for instance in Ranzi et al. (2017), could have contributed to increase the evapotranspiration rate (Birkinshaw et al., 2014). Also the changes in regulation of water uptake for irrigation purposes over the last century could have a significant impact on runoff regime. However further and detailed information about the evolution of land-use and human activities have to be collected in order to quantify their role in runoff variations.
Another important application of the high-resolution gridded precipitation dataset is the reconstruction of extreme past events. This task could be even more meaningful when dealing with daily data. However, most series in our database has daily resolution only after 1950, whereas before this year daily data are available only for a fraction of records. We limit therefore our analyses to the monthly resolution. In order to assess the ability of the applied methodology to capture the occurrence and distribution of extreme events, we consider as case study the month with the highest value in catchment precipitation record (November 2002 with an average of 576 mm) and represent the spatial distribution for both precipitation and anomalies over the domain in Fig. 4. As highlighted by the distribution of station points, the considered month is characterised by a dense data coverage, with more than 150 available stations inside Adda basin, which allows to depict in detail the spatial pattern of the exceptional precipitation event occurring over Adda river catchment during the central days of the month.
In order to further assess the robustness of single event reconstruction also when a lower data coverage is available, the anomaly and precipitation distributions for November 2002 are evaluated by reducing the number of series entering in the reconstruction and selecting only the stations available in 1882 and in 1922 (or the closest ones in case of records ending before 2002), i.e. 120 and 80 years before 2002, respectively (Fig. 5). As pointed out in Fig. 5, in both periods station availability is significant lower than in 2002 with 22 stations in 1922 and only one (Como station) in 1882 located inside Adda basin. Despite data coverage discrepancy, the comparison with the anomaly distribution obtained from all stations operating in 2002 (Fig. 4) highlights a remarkable agreement with the anomaly field depicted by means of 1922 station distribution (Fig. 5b). Even though the detailed structure of event is not completely captured, the leading spatial features are still evident even when the lowest station coverage of 1882 is considered (Fig. 5a). Moreover, the catchment precipitation for November 2002 estimated by 1882 and 1922 station density turns out to be only 10 and 6 %, respectively, lower than the one obtained with 2002 station availability. This case study shows therefore that thanks to the high spatial coherence of anomalies, the main features of a meteorological event could be reconstructed even when only a few number of stations is available and unevenly located over the study area. This test confirms also the reliability of the computed areal precipitation record for Adda basin which was discussed above and it provides further information about the impact of variations in station coverage on the variability of modelled values.
The analyses we performed show the great potential of the database and of the methodology applied for the construction of 1845–2016 gridded precipitation records. However, further analyses are required to investigate more in detail the error of grid point and catchment records, especially for the periods with lower data availability, as well as to improve trend evaluation by applying this analysis over different time windows for both precipitation and runoff series. The results could be useful to better explain the different behaviour of precipitation and runoff over upper Adda catchment and to identify the main forcing factors affecting the changes and interactions of these two variables. These analyses are in progress and they will be discussed in forthcoming papers.
The observation database of monthly precipitation for the study area was set up by the data retrieved from: ISPRA (Istituto Superiore per la Protezione e Ricerca Ambientale) archive (http://www.scia.isprambiente.it/home_new_eng.asp, last access: June 2018), ARPA Lombardia (http://www.arpalombardia.it/siti/arpalombardia/meteo/richiesta-dati-misurati/Pagine/RichiestaDatiMisurati.aspx, last access: June 2018), HISTALP archive (http://www.zamg.ac.at/histalp/, last access: June 2018), the database of CNR-ISAC (Italian National Research Council-Institute of Atmospheric Sciences and Climate) – Milan University (contact the authors of this paper for data requests), MeteoTrentino (https://www.meteotrentino.it/index.html#!/content?menuItemDesktop=141, last access: June 2018) and MeteoSwiss (https://gate.meteoswiss.ch/idaweb/, last access: June 2018). The precipitation climatologies over the study area are retrieved from the gridded dataset of 1961–1990 monthly climatologies which is freely available on ISAC-CNR website (http://www.isac.cnr.it/climstor/CLIMATE_DATA/, last access: June 2018).
AC, MM and MB managed the reconstruction of the gridded dataset of secular monthly precipitation series over the Adda river basin. RR and MT provided the 1845–2016 runoff record.
The authors declare that they have no conflict of interest.
This article is part of the special issue “17th EMS Annual Meeting: European Conference for Applied Meteorology and Climatology 2017”. It is a result of the EMS Annual Meeting: European Conference for Applied Meteorology and Climatology 2017, Dublin, Ireland, 4–8 September 2017.
We sincerely thank all data providers who contributed to set up the database
we used for the present study. We also thank the reviewers for their very
useful suggestions and comments which allowed to improve the quality of the
manuscript.
Edited by: Ole Einar Tveito
Reviewed by: Melita Perčec Tadić and one anonymous referee
Auer, I., Bohm, R., Jurkovic, A., Lipa, W., Orlik, A., Potzmann, R., Schoner, W., Ungersbock, M., Matulla, C., Briffa, K., Jones, P., Efthymiadis, D., Brunetti, M., Nanni, T., Maugeri, M., Mercalli, L., Mestre, O., Moisselin, J.-M., Begert, M., Muller-Westermeier, G., Kveton, V., Bochnicek, O., Stastny, P., Lapin, M., Szalai, S., Szentimrey, T., Cegnar, T., Dolinar, M., Gajic-Capka, M., Zaninovic, K., Mejstorovic, Z., and Nielplova, E.: HISTALP – historical instrumental climatological surface time series of the Greater Alpine Region, Int. J. Climatol., 27, 17-46, https://doi.org/10.1002/joc.1377, 2007.
Birkinshaw, S. J., Bathurst, J. C., and Robinson, M.: 45 years of non-stationary hydrology over a forest plantation growth cycle, Coalburn catchment, Northern England, J. Hydrol., 519, 559–573, https://doi.org/10.1016/j.jhydrol.2014.07.050, 2014.
Brugnara, Y., Brunetti, M., Maugeri, M., Nanni, T., and Simolo, C.: High-resolution analysis of daily precipitation trends in the central Alps over the last century, Int. J. Climatol., 32, 1406–1422, https://doi.org/10.1002/joc.2363, 2012.
Brunetti, M., Maugeri, M., Motti, F., and Nanni, T.: Temperature and precipitation variability in Italy in the last two centuries from homogenised instrumental time series, Int. J. Climatol., 26, 345–381, https://doi.org/10.1002/joc.1251, 2006.
Craddock, J.: Methods of comparing annual rainfall records for climatic purposes, Weather, 34, 332–346, https://doi.org/10.1002/j.1477-8696.1979.tb03465.x, 1979.
Crespi, A., Brunetti, M., Lentini, G., and Maugeri, M.: 1961–1990 high-resolution monthly precipitation climatologies for Italy, Int. J. Climatol., 38, 878–895, https://doi.org/10.1002/joc.5217, 2018.
Daly, C., Neilson, R. P., and Phillips, D. L.: A statistical-topographic model for mapping climatological precipitation over Mountanious Terrain, J. Appl. Meteorol., 33, 140–158, https://doi.org/10.1175/1520-0450(1994)033<0140:ASTMFM>2.0.CO;2, 1994.
Daly, C., Gibson, W. P., Taylor, G. H., Johnson, G. L., and Pasteris, P.: A knowledge based approach to the statistical mapping of climate, Clim. Res., 22, 99–113, 2002.
Efthymiadis, D., Jones, P. D., Briffa, K. R., Auer, I., Böhm, R., Schöner, W., Frei, C., and Schmidli, J.: Construction of a 10-min-gridded precipitation data set for the Greater Alpine Region for 1800–2003, J. Geophys. Res., 111, D01105, https://doi.org/10.1029/2005JD006120, 2006.
Isotta, F. A., Frei, C., Weilguni, V., Tadić, M. P., Lassègues, P., Rudolf, B., Pavan, V., Cacciamani, C., Antolini, G., Ratto, S. M., Munari, M., Micheletti, S., Bonati, V., Lussana, C., Ronchi, C., Panettieri, E., Marigo, G., and Vertačnik, G.: The climate of daily precipitation in the Alps: development and analysis of a high-resolution grid dataset from pan-Alpine rain-gauge data, Int. J. Climatol., 34, 1657–1675, https://doi.org/10.1002/joc.3794, 2014.
Masson, D. and Frei, C.: Long-term variations and trends of mesoscale precipitation in the Alps: recalculation and update for 1901–2008, Int. J. Climatol., 36, 492–500, https://doi.org/10.1002/joc.4343, 2016.
Mitchell, T. D. and Jones, P. D.: An improved method of constructing a database of monthly climate observations and associated high-resolution grids, Int. J. Climatol., 25, 693–712, https://doi.org/10.1002/joc.1181, 2005.
New, M., Hulme, M., and Jones, P.: Representing Twentieth-Century space-time climate variability. Part II: development of 1901–96 monthly grids of terrestrial surface climate, J. Climate, 13, 2217–2238, https://doi.org/10.1175/1520-0442(2000)013<2217:RTCSTC>2.0.CO;2, 2000.
Ranzi, R., Caronna P., and Tomirotti, M.: Impact of climatic and land use changes on riverflows in the Southern Alps, in: Sustainable Water Resources Planning and Management Under Climate Change, edited by: Kolokytha, E., Oishi, S., and Teegavarapu, R. S. V., Springer Science+Business Media, Singapore, 61–83, https://doi.org/10.1007/978-981-10-2051-3, 2017.
Ranzi, R., Bacchi, B., Tomirotti, M., Castioni, C., Brunetti, M., Crespi, A., and Maugeri, M.: Analisi delle tendenze di lungo termine nel regime degli afflussi meteorici e dei deflussi dell'Adda a Lecco (1845–2014), L'Acqua, 2, 51–60, 2018.
Servizio Idrografico: Osservazioni pluviometriche raccolte a tutto l'anno 1915. Volume II: Bacino Imbrifero del Po. Fascicolo I. Ministero dei Lavori Pubblici – Consiglio Superiore delle Acque, Roma, 1920 (in Italian).
Servizio Idrografico – Ministero dei Lavori Pubblici: Precipitazioni medie mensili ed annue e numero di giorni piovosi per il trentennio 1921–1950, Istituto Poligrafico dello Stato, 1–12c, 1957 (in Italian).