 | 31 Jul 2018
Current gust forecasting techniques, developments and challenges
Peter Sheridan
Gusts represent the component of wind most likely to be associated with serious hazards and structural damage, representing short-lived extremes within the spectrum of wind variation. Of interest both for short range forecasting and for climatological and risk studies, this is also reflected in the variety of methods used to predict gusts based on various static and dynamical factors of the landscape and atmosphere. The evolution of Numerical Weather Prediction (NWP) models has delivered huge benefits from increasingly accurate forecasts of mean near-surface wind, with which gusts broadly scale. Techniques for forecasting gusts rely on parametrizations based on a physical understanding of boundary layer turbulence, applied to NWP model fields, or statistical models and machine learning approaches trained using observations, each of which brings advantages and disadvantages.
Major shifts in the nature of the information available from NWP models are underway with the advent of ever-finer resolution and ensembles increasingly employed at the regional scale. Increases in the resolution of operational NWP models mean that phenomena traditionally posing a challenge for gust forecasting, such as convective cells, sting jets and mountain lee waves may now be at least partially represented in the model fields. This advance brings with it significant new questions and challenges, such as concerning: the ability of traditional gust prediction formulations to continue to perform as phenomena associated with gusty conditions become increasingly resolved; the extent to which differences in the behaviour of turbulence associated with each phenomenon need to be accommodated in future gust prediction methods. A similar challenge emerges from the increasing, but still partial resolution of terrain detail in NWP models; the speed-up of the mean wind over resolved hill tops may be realistic, but may have negative impacts on the performance of gust forecasting using current methods. The transition to probabilistic prediction using ensembles at the regional level means that considerations such as these must also be carried through to the aggregation and post-processing of ensemble members to produce the final forecast. These issues and their implications are discussed.


The works published in this journal are distributed under
the Creative Commons Attribution 4.0 License. This license does not affect
the Crown copyright work, which is re-usable under the Open Government
Licence (OGL). The Creative Commons Attribution 4.0 License and the OGL are
interoperable and do not conflict with, reduce or limit each
other.
© Crown copyright 2018
Gusts represent a brief, intense peak in wind typically responsible for the worst damage caused by winds. This can constitute damage to structures such as buildings, bridges and wind turbines, or arise from loss of control of air or road vehicles, and gust prediction is a crucial element of weather forecasting and climate services. A rigorous definition of a “gust” is required in order for the results of research to be generally applicable, and the World Meteorological Organization (WMO) recommends a definition based on a 3 s running mean wind speed, with the maximum in a 10 min interval taken as the gust for that interval (World Meteorological Organization, 2008).
This author previously conducted a survey of established gust forecasting techniques (Sheridan, 2011). These are based on physical reasoning and understanding of boundary layer turbulence, empirical results or tuning, and statistical analysis. Most techniques involve some combination of these bases, but generally the emphasis is on one aspect, allowing rough categorisation of approaches (Sheridan, 2011); the same categorisation is used here. For instance, methods which will be termed here “physically-based” interpret weather variables within a NWP model column in light of knowledge and physical reasoning concerning boundary layer turbulence and its manifestation at the surface in the form of gusts. The most common example in operational forecasting employs Monin-Obukhov similarity theory following Panofsky et al. (1977), Panofsky and Dutton (1984), Beljaars (1987), involving a scaling approach (physical) to determine the relevant scales for wind variance and height dependence, an empirically-determined universal function relating the resulting non-dimensionalised versions of variance and height, and the gust finally related to wind variance by assuming a 50 % exeedance probability based on universal turbulence spectra and the 3 s definition above (statistical). While not derived from first principles, the basis of this method on a structured theoretical understanding of turbulent processes, and measurements directed at constraining this understanding leads to the use of the term “physically-based”. This is as opposed, for example, to simply tuning a crude rule of thumb to observed gusts, or engineering fixes to improve forecast error scores.
Methods which will be termed statistical predominantly employ extreme value statistics (Palutikof et al., 1999), or models of the underlying wind distribution as a function of predictor variables. They are data-driven, with the statistical model fit to the available data, in a manner tailored to best accommodate the structure within the data. Coupling of extreme value theory with turbulence spectra provides a closed theory for turbulent gusts (Beljaars, 1987), validating in principle the extreme value approach. Statistical models are often used to define return periods of damaging gusts in a given climate.
Some recent studies of physically-based methods have focussed on evaluations comparing pre-existing gust parametrisations. For instance Schubiger et al. (2012) compare the COSMO gust diagnostic (Monin-Obukhov-based, but with an added linear empirical sustained wind term in some models to enhance stronger gusts, distinguishing it from other M-O-based diagnostics) with that of Brasseur (2001). Stucki et al. (2016) compare the same diagnostics with the standard WRF parametrisation and a simple empirical gust factor approach. Schubiger et al. (2012) find that the COSMO diagnostic performs better than the Brasseur method for a 2 km resolution model over Switzerland. Stucki et al. (2016) find little difference between diagnostics when applied to a 20th century WRF model reanalysis, again over Switzerland. Interest continues in developing better physically-based gust parametrisations (Cheng et al., 2012b; Suomi et al., 2013).
Recent examples of the use of statistical methods include Hofherr and Kunz (2010), whose study demonstrates the power of statistical approaches in extending detailed but limited datasets to apply to much longer periods. They use the maximum gust at a given model grid point in a 1 km resolution dynamical downscaling simulation of the worst storm in each year for 30 years to represent the annual maximum gust for that point, using this to construct an extreme value analysis. In this way the gust strength for different return periods was mapped over Germany at 1 km resolution using just 87 day-long simulations. Seregina et al. (2014) used the gustiness analysis of Wieringa (1986) and exposure correction of Verkaik (2000) to standardise wind and gust measurements between sites in Germany. They then constructed relationships between Weibull distribution parameters for extremes of the (sustained) wind and those for extreme gusts, so that synthetic gusts could be obtained at further sites reporting only sustained wind, enabling a more comprehensive gust return period analysis using a 10-year dataset. Others include Hewston and Dorling (2011), Thorarinsdottir and Johnson (2012), Cheng et al. (2012a, 2014), Jung and Schindler (2016), Jung et al. (2016), Efthimiou et al. (2017b), Efthimiou et al. (2017a).
Crossing between physical and statistical approaches, Roberts et al. (2014) created a statistical model based on gust output from a continuous 30-year run of the Met Office Unified Model (MetUM) on a 25 km grid over western Europe, which was generated using the MetUM gust diagnostic. So, a statistical gust model was created using a physically-based gust diagnostic, applied to output from an NWP model. The data were used to create an open access catalogue of the 50 most severe storms in the period (the eXtreme WindStorms, or XWS, catalogue). Such flexibility in approach is a recurring theme in gust prediction, in the effort to efficiently produce powerful products.
More recently, new methods and applications have come to the fore. For instance, machine learning methods are increasingly applied to modelling of sustained winds, and to some extent gusts. Also, applications in high-rise urban environments or for wind harvesting turbines have also taken the emphasis away from a purely near-surface prediction to consideration of the structure of a gust, as embodied in its vertical profile. Also new challenges and opportunities associated with increasing NWP model resolution emerge: small mesoscale structures associated with high winds and thought to be sources of strong gusts, as well potentially as the largest elements of boundary layer turbulence, begin to be resolved. A broad distinction can usefully be made here between mesoscale phenomena and resolved turbulence. The former involves a coherent, structured atmospheric flow induced by the stability and wind structure of the atmosphere, such as a microphysically-driven convective shower outflow, or a gravity wave, shaping the winds and turbulent spectrum experienced below. The latter represents part of the broad, self-similar spectrum of eddy motion itself. This is likely to be more amenable to partitioning between resolved and unresolved portions. Returning to the former case, meanwhile, where the true scale is tightly defined, for instance a gravity wave wavelength or the size of a convective shower, resolved motions may resemble the real structure in simplistic terms, but will be constrained in scale and structural complexity by the model grid and may thus behave and interact quite differently depending on how well they are resolved. These newer aspects constitute the main focus of this paper.
In the remainder of the paper, Sect. 2 discusses some growth areas in gust forecasting research, Sect. 3 describes challenges, for instance arising from increasing model resolution, and the final section gives summary conclusions.
In recent years, studies in meteorology motivated by wind energy extraction have moved from locating areas of high resource to considerations of production efficiency, consistency and control of supply to energy grids, and turbine fatigue, all of which depend on the relative gustiness and spatial profile of the wind to which they are exposed (Clifton and Wagner, 2014; Clifton et al., 2013). The location of turbines at different heights increasingly far from the surface further drives research toward characterising the vertical profile of gust activity, rather than merely a screen level or 10 m prediction. Other motivators for this development are in large scale urban engineering, where for instance the profile of wind and gust dictates the stress profile on a large building, and similarly, in forestry. Cheng et al. (2012b) address the development of improved physically-based gusts parametrisations, with an emphasis on the gust profile. Suomi et al. (2013, 2015, 2016, 2017) characterise gust profiles using measurements and pursue the development of gust parametrisations in this context. Efthimiou et al. (2017a, b) model the underlying wind distribution giving rise to gusts as extreme values, using direct numerical simulation (DNS) and wind tunnel measurements to inform and validate the model, which can be applied at any height, also testing at field sites. Consideration of gust profile is already commonplace in the engineering discipline. For instance Ngo and Letchford (2008, 2009) report results in profile terms when examining gust performance using various engineering codes for wind modification over or in the lee of topography.
Not only the spatial but also the time profile of gusts is of interest for similar reasons, since two gusts given equal numerical strength by some definition may have different impacts dependent on the temporal envelope of the wind fluctuation embodying the gust (Knigge and Raasch, 2016).
Gust prediction is often motivated by the need to model impacts. Often this is for the (re)insurance industry, where modelled gusts are coupled to some “loss model” (Dierer et al., 2015; Roberts et al., 2014; Welker et al., 2016), but more novel applications also exist. For instance, the Vehicle Overturning (VOT) Model at the Met Office uses gusts diagnosed from NWP data to forecast hazard risk for road users, where the risk measure is the combination of the hazard (the gust strength), exposure (e.g. the extent to which a road is oriented cross-wind), and vulnerability (how much the road is used by high-sided traffic). Jung and Schindler (2016), meanwhile, use a statistical gust model mapped to a 50 m grid as input to a forest damage model.
Wind gust is generally not one of the primary factors considered in assessments of climate change, though clearly an important potential impact. Recent studies that do address climate impacts include Cheng et al. (2012a, 2014), who employ statistical downscaling from a global circulation model (GCM) and a gust factor vs. wind speed characteristic, Seregina et al. (2014) (discussed above), and Hewston and Dorling (2011), who use UK routine observation sites for historic gust climate variability and a regional climate model's daily maximum wind as a proxy for gust in projections to a future climate.
Examples of machine learning applied to general wind forecasting are common Dunstan et al. (2016); Giorgi et al. (2014); Mohandes et al. (2004); Schicker et al. (2017); Sreelakshmi and Kumar (2008); Wang et al. (2015); Zeng and Qiao (2011). The agility of machine learning techniques in dealing with non-linear behaviour of predictand variables as a function of predictors makes them well suited to modelling extreme winds, which are frequently associated with highly non-linear atmospheric phenomena (e.g. gravity wave breaking, deep convection) that are difficult to parametrise using reductionistic approaches. Application with gusts, however, often focusses on the detection (identification) of gusts presently occurring, for mitigation in flight control systems (Afridi et al., 2010; Antonakis et al., 2016; Tedrake et al., 2009), exposure of wind turbines to damage or power fluctuations (Spudic et al., 2009), or prediction of wind power variation as the result of turbulence and wind shear (Clifton and Wagner, 2014; Clifton et al., 2013). Studies in a meteorological context prove harder to find, but there are examples, and an indication that there is considerable promise in such approaches.
Mercer et al. (2008) used a range of eighteen relevant synoptic (wind-, stability-, and weather situation-related) and terrain factors of the Colorado Front range, including parameters commonly associated with mountain wave diagnosis, to attempt to statistically model gusts (peak wind within consecutive 3 h periods in the day) associated with the famous Boulder windstorm phenomenon (Lilly and Zipser, 1972) as a function of these predictors, by training using observed near-surface winds. A multiple linear regression was used as a control and a neural network and support vector regression (SVR) as two non-linear test methodologies. SVR using a polynomial kernel function was found to yield significantly better predictions of Foehn gusts than the other two (which performed roughly equally) when applied to radiosonde profiles and output compared to measurements at surface wind sites. Mercer and Dyer (2014) also extended the approach to use 3-D data of wind, temperature and humidity at a given height from the NAM model within 20 km of the site of interest as input to SVR to predict daily peak gusts for 10 cities in the US, both in plain and complex terrain locations. Data were reduced first using kernel principal component analysis (KPCA). The results compared to conventional model output statistics (MOS) based on linear regression show radical improvement in RMSE and biases. Tuning of kernel functional type and other SVR parameters to each location was found to be beneficial. The use of 3-D fields (albeit in a 20 km radius) suggests that some benefit may also originate from the method being freed from the columnar constraints common to many gust forecasting approaches. In a similar vein, Nerini et al. (2014) used the AdaBoost classification tree algorithm to nowcast Foehn gusts in Switzerland using a set of predictor variables typically associated with Foehn.
Sallis et al. (2011) used a classification and regression tree methodology (CART) performing predictions based upon current meteorological variables at the site of interest (in New Zealand), finding that this performed better than logistic regression and than other machine learning approaches such as neural networks, and had some skill when used at very short (30 min) nowcasting range. Shanmuganathan and Sallis (2014) extend the study, using some methods not considered in the first, finding that different statistical/machine learning approaches emphasise different predictor variables. For instance, the sustained wind speed was the primary predictor in all methods apart from PCA, where relative pressure, temperature and humidity are the primary predictors, and wind speed and direction were the least important. Of course local pressure perturbations and wind gusts are likely to be intimately linked.
Chaudhuri and Middey (2011) applied an adaptive neuro-fuzzy inference system (ANFIS) to forecast daily maximum gust in Kolkata in a given day based on radiosonde profiles for a subset of 140 (70 for training, 70 for test) thunderstorm days taken from 12 years of pre-monsoon season. A comprehensive selection of stability indices (lifted index, CAPE, CIN, bulk Richardson number, and others) potentially relevant to thunderstorm gusts are used as input to the model (though the four named prove the most consistent and are retained as the final model predictor set). Chaudhuri and Middey (2011) term ANFIS a hybrid method partly because a neural network occupies a central layer, and inputs and outputs to/from this layer are fuzzy categories rather than actual data (which has instead been processed into these categories (input) or constructed from them (output)). A “backward and forward” technique is used to optimise the system. ANFIS was found to perform better than non-hybrid NN approaches (which lie closer to multiple linear regression in performance) for Kolkata thunderstorms.
Other studies have used machine learning as part of a general approach, such as Jung and Schindler (2016), who employ the LSBoost regression tree algorithm to optimise a relationship derived between parameters of a gust statistical distribution and a set of external predictors. Though, as a statistical model, their formulation does not contain explicit physical reasoning, the study does benefit from an astutely chosen set of relevant topographic, fetch and meteorological variables as model inputs. As was the case for Chaudhuri and Middey (2011), this demonstrates the added value that emerges from ensuring some physical awareness within the design (it seems likely that additional variables not considered, e.g. relating to stability, could add further value). Wang et al. (2017a, b) discuss “physics informed” machine learning for modelling turbulence (Reynolds stresses), utilising DNS data of idealised flows.
It is interesting that the approach in some machine learning studies such as those of Mercer et al. (2008), and Chaudhuri and Middey (2011) is shaped by the phenomenon causing the gust. Meanwhile, Mercer and Dyer (2014) use a very general approach applying to very diverse geographic and climatological locations, but require a large (3-D) dataset as input, and consequently a data reduction step, in their method.
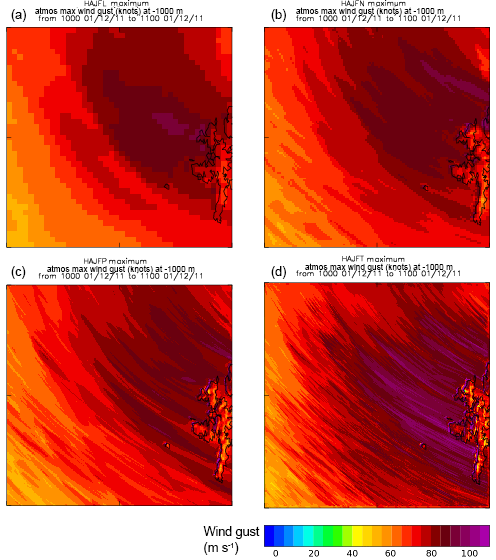
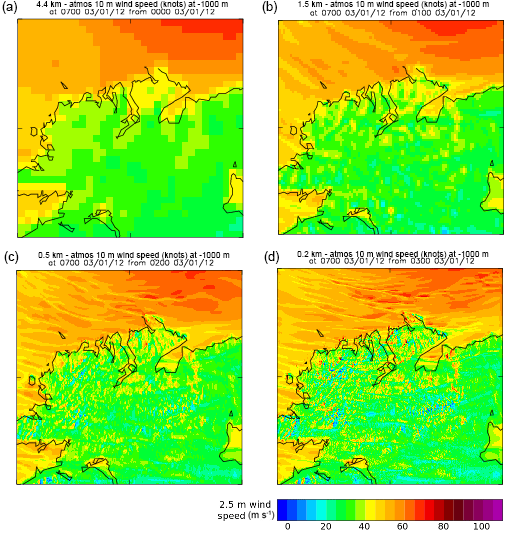
Figure 1The maximum gust over the previous hour, shown for an area west of Shetland on 1 December 2011 at 10:00 UTC for four MetUM nested domain resolutions: (a) 4.4 km, (b) 1.5 km, (c) 500 m and (d) 200 m.
The applicability of machine learning to sustained wind (as opposed to gust) modelling, on the one hand suggests that gusts should also be amenable to the same kind of approach, but on the other that a direct approach to gust forecasting using machine learning is not strictly necessary. Instead, combined or hybrid approaches can be valuable; where an existing machine learning method adds value, for instance to NWP forecasts of the sustained wind (or other parameters upon which typical gust parametrisations depend), any effective method could then be used to obtain the gust, such as a physically-based parametrisation, propagating this added value to an improved gust forecast.
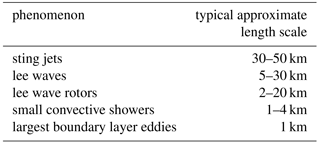
As NWP models on which gust forecasts are likely to be based move to increasingly fine grids, they become more able to resolve terrain and atmospheric phenomena that were previously firmly below the grid scale, and by default part of the melange of sub-grid variability that parametrisations, such as gust diagnostics, must try to accommodate. These atmospheric phenomena include gravity waves, such as mountain lee waves and associated rotors (Doyle and Durran, 2002, 2007; Durran, 1986; Grubisic et al., 2008; Hertenstein and Kuettner, 2005; Lilly and Zipser, 1972; Mobbs et al., 2005; Scorer, 1949; Sheridan et al., 2017; Shutts, 1997; Vosper, 2004), sting jets (Baker et al., 2014; Hart et al., 2017; Hewson and Neu, 2015; Martinez-Alvarado et al., 2012, 2014; Volonte et al., 2017), small convective cells such as those present in cold air outbreaks, that typically deliver showery rain accompanied by gusty winds, and the largest boundary layer eddies. Clearly this group straddles the categories of turbulence and mesoscale variability, albeit including examples of the latter associated with the local generation of increased winds and turbulence. Models' new ability to begin to resolve these phenomena directly presents an opportunity to improve associated gust forecasts. Meanwhile, wherever localised turbulent effects or high winds induced by these phenomena are not accommodated within the theoretical basis of a given gust diagnosis, there is also the challenge to do so. Of course, resolution is at best partial (structures “permitted” rather than “resolved”) and so modellers are presented with a gust “grey zone” issue, with several turbulent or turbulence/high wind-inducing phenomena occupying it, therefore creating a set of “parallel” grey zones relating to wind extremes. The typical length scales associated with these phenomena are listed in Table 1.
Table 1List of boundary layer and mesoscale phenomena associated with high or gusty winds, and the rough horizontal length scale ranges associated with each. For structures with potentially high aspect ratios, the shortest length scale is given (likely to be most relevant to the ability of NWP models to resolve them).
A case study highlighting this issue occurred when gusts in the operational 1.5 km resolution Met Office UKV during a cold air outbreak on 1 December 2011 west of Shetland were found to be overestimated. Subsequently, the case was modelled using successively finer horizontal grids using the MetUM in a 1-way nested configuration (Mark Weeks, Met Office). A second case, Cyclone Ulli (3 January 2012), was also simulated. Nests at resolutions of 4.4 km, 1.5 km, 500 m and 200 m were used. Figures 1 and 2 show the operational 10 m gust diagnostic in the four nested domains for the two cases, over the area of the 200 m resolution domain. The operational output consisted of the maximum over the previous hour of the MetUM gust diagnostic (Sheridan, 2011). There is a clear trend as resolution increases of stronger gusts covering a wider area, and especially at 200 m resolution, larger peak gust values (point observation time series were also used to substantiate this). Figure 4 shows cross-flow sections of wind from the 1 December 2011 case, at the section location shown in Fig. 3. Filamentary structures viewed from above in Fig. 3 are found to be related to convective overturning at low levels to form boundary layer rolls (hook-like structures in cross-section in the figure, which precipitation maps show represent showers) and accompanying areas of strong wind reaching the surface in downdrafts, which become more apparent with increasing resolution. Effectively, flow structures previously parametrised within the gust diagnostic become partially resolved in the model. This is illustrated in Fig. 5, which shows areas of locally much stronger winds for the finer domains. Applying the gust diagnostic in these downdraft areas represents a “double-counting” of the perturbation constituting the gust, with erroneously large gust values possible. The use of the hourly maximum gust exacerbates this, where small areas of overlarge gusts can contaminate a long “smear” of the domain. Instantaneous diagnosed gusts were found to be much less excessive in time series comparisons; using an hourly mean instead of maximum of the gust diagnostic was also found more representative. This can be seen as a “grey zone” problem, encountered depending on the resolution of the model and the scale of the convective structures.
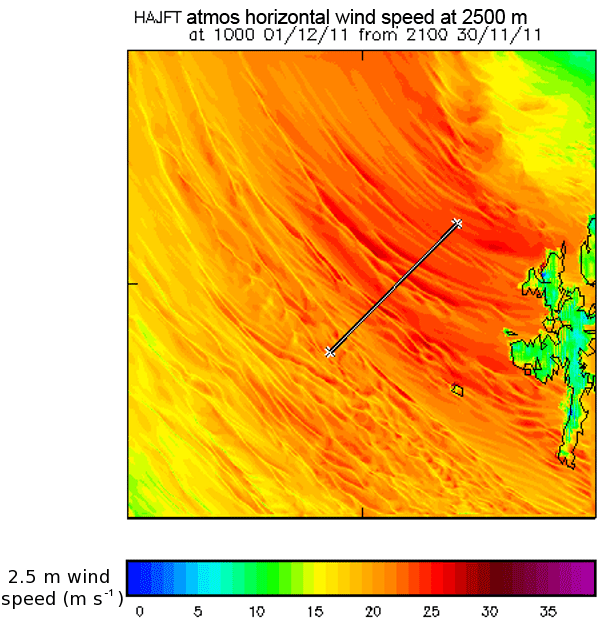
Figure 32.5 m (level 1) winds from a 200 m resolution MetUM nested domain on 1 December 2011 at 10:00 UTC, in an area West of Shetland. The straight line in the middle of the plot gives the location of vertical cross-sections shown in Fig. 4.
Sting jets are another phenomenon involving relatively localised vertical motion, to which have been attributed a number of cases involving extreme gust damage, such as the “Great Storm” in 1987 in the UK. These represent a descending jet originating from the cloud head behind a bent-back cold front, driven by slantwise CAPE, and possibly evaporation from the cloud head, and distinct from jets associated with the warm and cold conveyor belts; typically sting jets are found in explosively developing cyclones (Hart et al., 2017; Martinez-Alvarado et al., 2012, 2014).
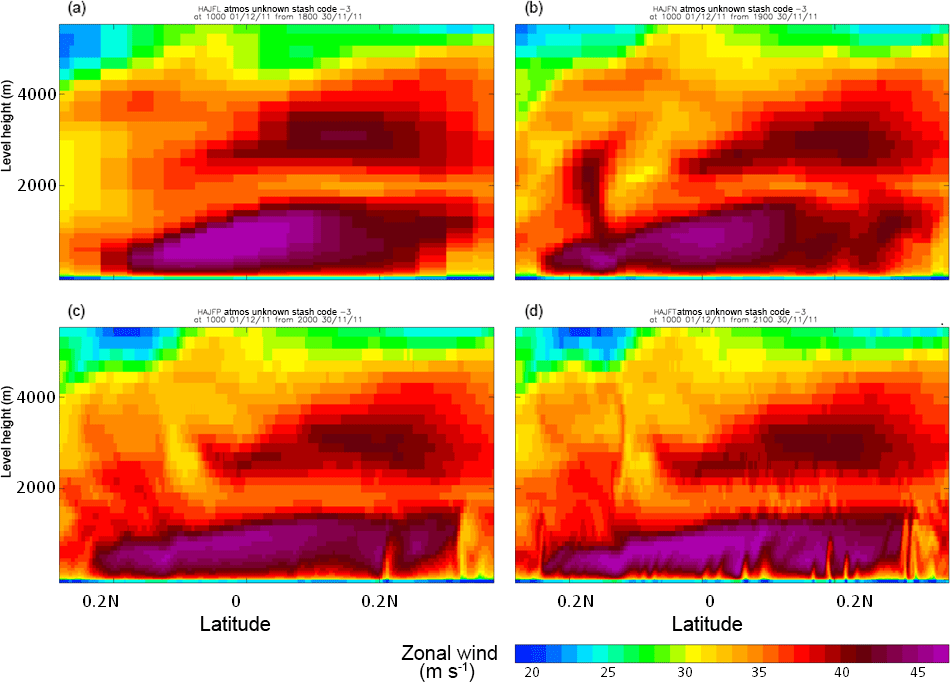
Figure 4Vertical cross-sections of zonal wind component in each of four nested MetUM domains, (a) 4.4 km, (b) 1.5 km, (c) 500 m and (d) 200 m. Cross-section position indicated in Fig. 3.
Baker et al. (2014); Hewson and Neu (2015); Martinez-Alvarado et al. (2014) give useful schematic depictions of the jet's integration within the cyclone system. Martinez-Alvarado et al. (2014) and Volonte et al. (2017) use back trajectories to confirm this conceptual picture, while Young and Clark (2018) demonstrate how lesser sting jets may be able to enhance winds in weaker storms. Volonte et al. (2017) use a 12 km model grid, demonstrating that very high resolution is not needed for sting jets to be present.
Extreme winds associated with sting jets may reach the surface as a result of the weakness of low level stability, and thus current gust diagnostic formulations sensitive to this might be suitable to predict associated gusts. The slantwise route of these winds, meanwhile, casts some doubt. Gust diagnostics generally operate only using data from the current model column, while gusts in reality may occur effectively due to conditions in adjacent columns, and more research is needed to test the significance of this. The “grey zone” with respect to this phenomenon concerns the ability of the model to sufficiently resolve the jet itself in the first instance, but also may concern the representation of the jet's interaction with the surface; the ability of typical NWP gust diagnostics to perform relies on a good representation of the vertical profile of temperature and wind, and in turn on the performance of vertical mixing parametrisations responding to the presence of the jet and the resolution of its intensity and structural detail. Martinez-Alvarado et al. (2012) and Hart et al. (2017) develop a precursor diagnostic for the likelihood of sting jets in a given cyclone (detection using back trajectories is likely to be involved and uncertain on a routine automated basis). This suggests it may be possible to designate sting jets so that conditional/adaptive methods could be used in forecasting associated gusts.
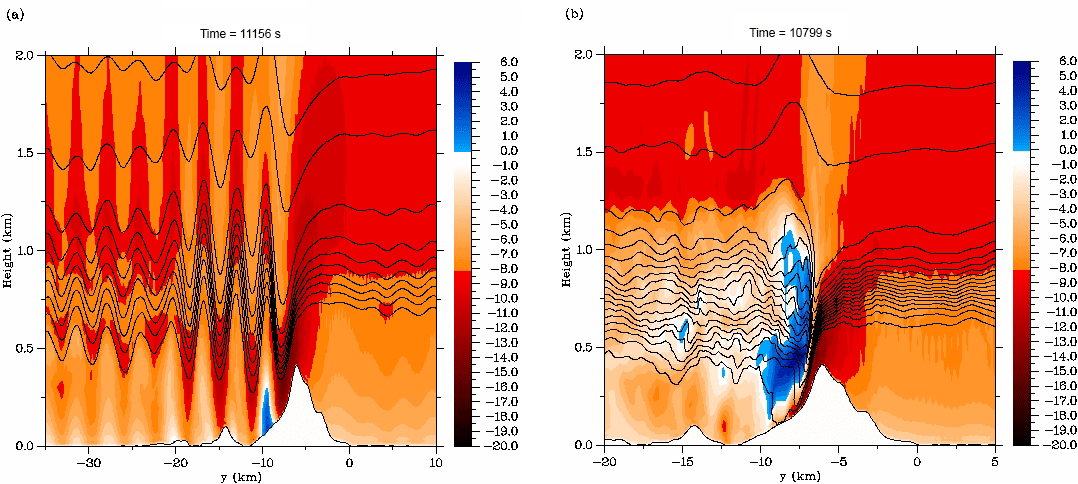
Figure 6Cross-sections through idealised 3-D simulations of rotors of (a) type 1 and (b) type 2, reproduced from Sheridan and Vosper (2006), showing horizontal wind component along the plane of the cross-section. Flow is from right to left.
Lee waves are gravity waves initiated by hilly or mountainous terrain, ducted in some layer downstream in the lower troposphere (Scorer, 1949; Shutts, 1997; Vosper et al., 2006), and can be accompanied by severe perturbation of the near-surface flow (Doyle and Durran, 2002). This constitutes alternating areas of accelerated and decelerated flow. Deceleration, occurring beneath a wave crest, may be sufficient to cause reversal and separation of the flow from the surface, to form a “rotor” – conceptually a rough, horizontal-axis vortex of recirculation (Doyle and Durran, 2002; Hertenstein and Kuettner, 2005; Sheridan et al., 2017, 2007; Vosper et al., 2006). Idealised simulations using the terrain of the Falkland Islands demonstrate this in Fig. 6, reproduced from Sheridan and Vosper (2006). High levels of turbulence and strong winds are typically associated with rotors, and rotors can occur on quite different scales depending on the mountain range and atmospheric conditions that give rise to the associated lee waves (Grubisic et al., 2008). Figure 6 shows areas of rotor flow reversal in blue for the two common “types” of rotor, “1” and “2”. The rotor vortex and its constraint by the quasi-stationary wave structure direct and confine turbulence in a coherent way that does not occur for a horizontally isotropic boundary layer. Doyle and Durran (2007) model how sub-vortices in the main recirculation separate with the flow and intensify, and return to the surface at the reattachment point in type 1 rotors, with the most gusty winds at the separation point and light winds and turbulence beneath the remainder of the crest. Accelerated but relatively less gusty winds occur on the downslope and beneath wave troughs (tending to be stronger in the type 2 case). The non-local source of rotor turbulence calls the single-column approach of typical gust diagnostics into question for rotor situations, as does the departure of the turbulence generation mechanism in rotors from the basic model implicit in such diagnostics, and again research is needed to see if they are adequate.

Figure 7(a) UK area MSG visible satellite image at 14 Z 16 March 2017, showing distinctive banded cloud associated with lee waves over Wales and Northern England ahead of a cold front. (b) Output from the Met Office Vehicle Overturning (VOT) model valid 11–19 Z 16 March 2017, colouring of major routes follows a four-stage “traffic light” designation of risk from green through yellow and amber to red.
The “grey zone” issue associated with lee wave rotors concerns, in the first instance, the model grid spacing compared to the possible range of lee wave wavelengths, but subsequently also the relative ability of the model to resolve the sub-rotor turbulence structure that gives rise to the formation of gusts, which may differ significantly from the structure assumed in typical turbulence parametrisations.
The ability to resolve lee waves is nevertheless valuable for forecasting their impacts. For instance, Fig. 7 demonstrates output from the Met Office VOT Model, which takes input gust information from the Met Office MOGREPS-UK 2.2 km resolution ensemble forecast. Despite the relatively marginal ability to resolve waves at this grid spacing, hazards to high-sided vehicles are highlighted on various routes in the lee of large terrain in England and Wales during a moderate lee wave case.
The common theme so far is a failure of the simple columnar approach to take into account the lagrangian aspects that take turbulence from its source to where it is felt, and which are particular to the structure of the phenomenon in question in more complex meteorological or terrain-influenced flows.
The immediate influence of terrain on the wind flow results in speed-up over hill tops and can result in flow separation and wakes behind obstacles (Mason and Sykes, 1979). In engineering, such terrain influence is commonly accounted for. For instance, Ngo and Letchford (2008) present comparisons of sustained winds and gusts diagnosed in conjunction with various heuristic engineering codes for speed-up over terrain obstacles. Ngo and Letchford (2009) evaluate the schemes in relation to wind tunnel measurements of the sustained wind and gust profile with height.
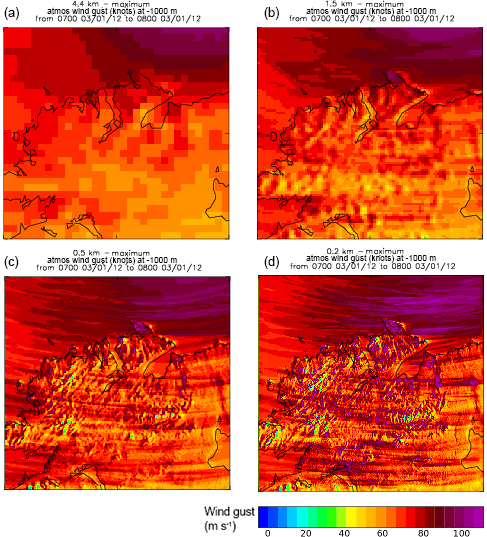
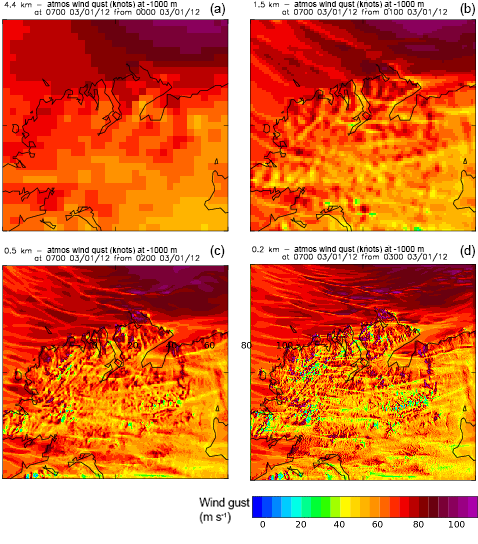
Direct terrain influence on gust is often not explicitly dealt with in meteorological contexts, meanwhile. As NWP model resolution improves, larger variations in resolved wind occur within a given area. Gust formulations at many Met services take resolved (given to imply “sustained”) wind as input (Sheridan, 2011) so that any increase in wind is amplified in the output gust field. This is unlikely to be representative since the cause of the gust is turbulence resident in the boundary layer as a whole, while local features, unless very steep, have more influence on the modulation of the sustained wind. For instance, Ngo and Letchford (2009) quote Holmes (2001), that gust speed over hill tops is not enhanced to the same degree as wind speed. With the NWP approach, as terrain is more finely resolved, associated resolved wind maxima increase, and the parametrised gust will also continue to increase, so that gusts may locally be increasingly overestimated. This is demonstrated in Figs. 5 and 8 showing instantaneous wind and instantaneous gust respectively for a snapshot from the nested simulations of cyclone Ulli, already mentioned.
The above underlines the care needed if neighbourhood processing is used to create a PDF for probabilistic forecasting, since localised, erroneously large gusts on terrain peaks would then adversely influence the forecast for locations well away from the peaks. One solution would be to develop rules such as those described by Ngo and Letchford (2008, 2009) to diagnose and so mitigate the issue (Standen et al., 2017; Wilson et al., 2010). An alternative is to use terrain elevation masking, so that the neighbourhood of a site of interest is filtered to only include other model points of similar elevation (Nigel Roberts, personal communication, 2017).
It seems possible that a method similar to the TKE-based method of Brasseur (2001), which is sensitive to the wind momentum aloft which may be transferred to the surface, rather than primarily the wind pattern at the surface, may be less subject to the problems cited above, which are most often due to strong resolved near-surface winds which were not present in coarser resolution NWP model predecessors.
Two distinct approaches to tackling the “grey zone” challenge were proposed in another contribution (Mylne and Roberts, poster P85 in session UP1.4 of this conference). The first involves neighbourhood processing to determine a PDF of 10 m the model wind speed and MetUM gust diagnostic over the surrounding points. For typical shear-driven gusts, the mode or median of the gust diagnostic PDF is assumed to be representative. For convective gusts, some high percentile of the 10 m wind PDF is taken to represent the gust; the percentile used would be “calibrated” to reflect the relative realism of convective intensity permitted in the model. No attempt is made to determine which conditions actually apply in the case in question, and the maximum of these two values is taken as the gust prediction. Elevational masking is used to ensure only grid points with like topographic character are included in the neighbourhood.
The second involves instead an explicit diagnosis of convectively active areas (for instance using the sharpness of precipitation gradients or gradients in the 10 m wind). In convective areas, the 10 m neighbourhood winds are used to calculate the gust, while the gust diagnostic is used in non-convective areas. This could be extended to also treat areas affected by sting jets or lee waves separately if necessary, for instance by diagnosing the appropriate precursors in the large scale flow. Otherwise, lee waves may not be well treated by the neighbourhood approach since the neighbourhood may unhelpfully mix the very different wind and gust behaviour of trough and crest areas. And while sting jets are technically akin to convective gusts, particularly if low-level stability mediates whether or not touch-down occurs, their slanted structure may mean areas of strong winds and precipitation gradients do not coincide, so that they also need a separate diagosis method.
In the case of large boundary layer eddies the grey zone problem is perhaps more straightforward. Here, the turbulent spectrum could be truncated at the effective model resolution and extreme value theory applied to the remainder of the spectrum. Analogous approaches have been made in other applications involving small scale variability, such as to combine and weight a 1-D turbulence closure and 3-D sub-grid turbulence scheme within a single parametrisation for mixing (Boutle et al., 2014), by gauging the effective resolved scale for a particular quantity, depending on the expected eddy scale for a given weather regime. The study in turn follows similar studies regarding, for instance, parametrisation of sub-grid updraft velocity for cloud activation (Malavelle et al., 2014).
Another challenge regards the accuracy of ancillary data and how it influences the forecast of gust in NWP models. Friction velocity depends on the effective surface roughness, diagnosed imperfectly from land surface datasets, which themselves may be interpreted for instance using generalisations concerning satellite data, and may be of inferior resolution or out-of-date. As the grid scale decreases, the appropriate effective roughness may not relate directly to the model grid box in which the gust is predicted, but to the upwind fetch also. Grid boxes may be small enough that turbulence in the column would not be expected to have adjusted from its state in the upwind column.
The transition away from deterministic forecasts towards ensembles and probabilistic products is a further new challenge – how best to aggregate NWP model output information on gusts in the final product. The statistical elements of gust diagnosis (basis in turbulence spectra and extreme values), suggest amenability to aggregation in this way. Questions remain, however, around the incorporation of outlying members, which may represent a different regime to the dominant group at a given location. The combination of neighbourhood aggregation, lagged ensembles, and post-processing with the basic ensemble idea, adds complexity to the task of ensuring correct aggregation and transmission of gust information end-to-end in NWP systems. This may unhelpfully constrain the level of sophistication that can be practically justified in the gust diagnosis. Would a change of philosophy be useful in undertaking this task, such as preserving the statistical nature of turbulence in some form until an output is required at some level of processing (e.g. raw model data, filtered data, gridded products, site-specific products)? Should a stochastic physics approach extend to gust formulations? The ever-present difficulty of verifying gusts, which are due to their sporadic and stochastic nature difficult to model with point accuracy, with sparse observations will presumably be greater when probabilistic forecasts must be verified. Nevertheless, given this stochastic nature, a probabilistic approach seems to offer some advantages.
Gust impacts continue to broaden as human activities diversify and their forecasting and mitigation is perhaps more valuable than ever. Growth in wind energy harvesting, and knowledge of the implications of gusty winds for turbine lifespan, energy efficiency and generation reliability has emerged as a major motivator for research. Large scale and high rise urban planning also accelerates as economies develop, and both of these areas require higher-dimensional information on wind variability and its impacts, than simply a low level gust. The use of UAVs which may be sensitive to gusts and turbulence is ever increasing.
Machine learning has been relatively sparsely used in gust forecasting, and opportunities remain for its exploitation, which seems to hold promise of significant improvements in accuracy. The variety of techniques is abundant, and while this may make the best method harder to isolate, it also allows for flexibility of approach, with the best technique perhaps depending on geography and the gust generaton mechanism in question.
Statistical methods continue to offer new ways of efficiently creating powerful results concerning gust risk by extending limited model or observational datasets. The climatological emphasis of most studies extends more and more towards climate change guidance.
Physically-based approaches continue to have value, but increasing NWP model resolution represents a challenge as well as an opportunity. The improving representation of small-scale atmospheric phenomena allows for a better identification of weather situations likely to give rise to gusty conditions (lee wave rotors, convective showers, sting jets), and a better representation of the distribution and variability of the mean wind as a function of terrain exposure. Meanwhile, current gust diagnostic formulations typically assume gusts originate from isotropic turbulence associated with a boundary layer over flat terrain, and so gusts can be diagnosed from within the model column. But when turbulence is controlled by a structured low-level phenomenon such as lee wave rotors or convective showers, this assumption is flawed. Research is needed to understand the extent of this problem and suggest modified approaches.
The problem is exacerbated since the phenomenon in question is likely to be partially resolved, and to a different extent for a given phenomenon, climate, geography, case study or NWP model. This can be thought of as a “grey zone” for a given mesoscale structure type. Two approaches to mitigate this have been suggested in a separate conference paper. The first involves calculating two gust predictions, one based on the resolved variability of wind in the model grid boxes surrounding a particular location, and one on existing gust formulations, looking at some average over the surrounding points. The second involves an automated diagnosis of the weather situation to decide which approach to use.
Increasingly high resolution creates higher demands on the representativity of land surface datasets, which govern the crucial quantity of (effective) surface roughness. For sufficiently small grid boxes, the turbulence in a given column may represent a fetch of a number of grid boxes, so that local parameters are not sufficient for its characterisation.
The use of ensemble and probabilistic products should improve the quality and relevance of forecasts but also brings another layer of challenge for optimal processing of model data and forecast verification, where the devil may be in the detail.
These problems aside, physically-based approaches can have a “plug and play” quality that allow them to be combined with other approaches to create a useful product, for instance to create statistical models (Roberts et al., 2014) or provide input to hazard models. Combined methodologies in general are frequently powerful (Chaudhuri and Middey, 2011; Efthimiou et al., 2017a, b; Jung and Schindler, 2016).
No data sets were used in this article.
The author declares that there is no conflict of interest.
This article is part of the special issue “17th EMS Annual Meeting: European Conference for Applied Meteorology and Climatology 2017”. It is a result of the EMS Annual Meeting: European Conference for Applied Meteorology and Climatology 2017, Dublin, Ireland, 4–8 September 2017.
The author is very grateful to a number of people at the Met Office for
discussions, ideas and contributing content: Mark Weeks, Rebecca Hemingway,
Jess Standen, Ken Mylne and Nigel Roberts. DWD/Hans Ertel centre
(Sabrina Wahl, Martin Goeber) very kindly funded conference attendance. The
author thanks reviewers Anton Beljaars and Ben Wichers Schreur, whose useful
and knowledgeable comments helped improve and round out the manuscript.
Edited by: Sabrina Wahl
Reviewed by: Ben Wichers Schreur and Anton Beljaars
Afridi, M. J., Awan, A. J., and Iqbal, J.: AWG-Detector: A Machine Learning tool for the Accurate Detection of Anomalies due to Wind Gusts (AWG) in the Adaptive Altitude Control Unit of an Aerosonde Unmanned Aerial Vehicle, in: 10th International Conference on Intelligent Systems Design and Applications, 2010. a
Antonakis, A., Lone, M., and Cooke, A.: Neural Network Based Dynamic Model and Gust Identification System for the Jetstream G-NFLA, in: Proceedings of the Institution of Mechanical Engineers, Part G: Journal of Aerospace Engineering 231, 1138–1153, 2016. a
Baker, L. H., Gray, S. L., and Clark, P. A.: Idealised simulations of sting-jet cyclones, Q. J. Roy. Meteor. Soc., 140, 96–110, 2014. a, b
Beljaars, A. C. M.: The influence of sampling and filtering on measured wind gusts, J. Atmos. Ocean. Tech., 4, 613–626, 1987. a, b
Boutle, I. A., Eyre, J. E. J., and Lock, A. P.: Seamless Stratocumulus Simulation across the Turbulent Gray Zone, Mon. Weather Rev., 142, 1655–1668, 2014. a
Brasseur, O.: Development and application of a physical approach to estimating wind gusts, Mon. Weather Rev., 129, 5–25, 2001. a, b
Chaudhuri, S. and Middey, A.: Adaptive neuro-fuzzy inference system to forecast peak gust speed during thunderstorms, Meteorol. Atmos. Phys., 114, 139–149, 2011. a, b, c, d, e
Cheng, C. S., Li, G., Li, Q., Auld, H., and Fu, C.: Possible Impacts of Climate Change on Wind Gusts under Downscaled Future Climate Conditions over Ontario, Canada, J. Climatol., 25, 3390–3408, 2012a. a, b
Cheng, C. S., Lopes, E., Fu, C., and Huang, Z.: Possible Impacts of Climate Change on Wind Gusts under Downscaled Future Climate Conditions: Updated for Canada, J. Climatol., 27, 1255–1270, 2014. a, b
Cheng, X., Wu, L., Hu, F., and Zeng, Q.-C.: Parameterizations of some important characteristics of turbulent fluctuations and gusty wind disturbances in the atmospheric boundary layer, J. Geophys. Res., 117, D08113, https://doi.org/10.1029/2011JD017191, 2012b. a, b
Clifton, A. and Wagner, R.: Accounting for the effect of turbulence on wind turbine power curves, J. Phys. Conf. Ser., 524, 012109, https://doi.org/10.1088/1742-6596/524/1/012109, 2014. a, b
Clifton, A., Kilcher, L., Lundquist, J. K., and Fleming, P.: Using machine learning to predict wind turbine power output, Environ. Res. Lett., 8, 024009, https://doi.org/10.1088/1748-9326/8/2/024009, 2013. a, b
Dierer, S., Stucki, P., and Brönnimann, S.: High resolution weather models for storm simulations: uncertainty of results and impact on loss simulations, in: 5th Workshop on European Storms, 2015. a
Doyle, J. D. and Durran, D. R.: The dynamics of mountain-wave-induced rotors, J. Atmos. Sci., 59, 186–201, 2002. a, b, c
Doyle, J. D. and Durran, D. R.: Rotor and subrotor dynamics in the lee of three-dimensional terrain, J. Atmos. Sci., 64, 4202–4221, 2007. a, b
Dunstan, T., Lock, A., and Skea, A.: Empirical error correction and feature identification for long term wind resource assessment using support vector regression, J. Renew. Sust. Energ., 8, 013305, https://doi.org/10.1063/1.4942120, 2016. a
Durran, D. R.: Another look at downslope windstorms. Part I: The development of analogs to supercritical flow in an infinitely deep, continuously stratified fluid, J. Atmos. Sci., 43, 2527–2543, 1986. a
Efthimiou, G. C., Andronopoulos, S., and Bartzis, J. G.: CFD-RANS prediction of wind speed probability distributions over a very rough surface in the atmospheric surface layer, J. Comput. Appl. Math., submitted, 2017a. a, b, c
Efthimiou, G. C., Hertwig, D., Andronopoulos, S., Bartzis, J. G., and Coceal, O.: A Statistical Model for the Prediction of Wind-Speed Probabilities in the Atmospheric Surface Layer, Bound.-Lay. Meteorol., 163, 179–201, 2017b. a, b, c
Giorgi, M. G. D., Campilongo, S., Ficarella, A., and Congedo, P. M.: Comparison Between Wind Power Prediction Models Based on Wavelet Decomposition with Least-Squares Support Vector Machine (LS-SVM) and Artificial Neural Network (ANN), Energies, 7, 5251–5272, 2014. a
Grubisic, V., Doyle, J. D., Kuettner, J., Mobbs, S., Smith, R. B., Whiteman, C. D., Dirks, R., Czyzyk, S., Cohn, S. A., Vosper, S., Weissmann, M., Haimov, S., Wekker, S. F. J. D., Pan, L., and Chow, F. K.: The Terrain-Induced Rotor Experiment: a field campaign overview including observational highlights, Bull. Am. Meteorol. Soc., 89, 1513–1533, 2008. a, b
Hart, N. C. G., Gray, S. L., and Clark, P. A.: Sting-Jet Windstorms over the North Atlantic: Climatology and Contribution to Extreme Wind Risk, J. Clim., 30, 5455–5471, 2017. a, b, c
Hertenstein, R. F. and Kuettner, J.: Rotor types associated with steep lee topography: Influence of the wind profile, Tellus A, 57, 117–135, 2005. a, b
Hewson, T. D. and Neu, U.: Cyclones, windstorms and the IMILAST project, Tellus A, 67, 27128, https://doi.org/10.3402/tellusa.v67.27128, 2015. a, b
Hewston, R. and Dorling, S. R.: An analysis of observed daily maximum wind gusts in the UK, J. Wind Eng. Ind. Aerodyn., 99, 845–856, 2011. a, b
Hofherr, T. and Kunz, M.: Extreme wind climatology of winter storms in Germany, Clim. Res., 41, 105–123, 2010. a
Holmes, J. D.: The atmospheric boundary layer and wind turbulence, in: Wind Load. Struct., Spon Press, UK, 2001. a
Jung, C. and Schindler, D.: Modelling monthly near-surface maximum daily gust speed distributions in Southwest Germany, Int. J. Climatol., 36, 4058–4070, 2016. a, b, c, d
Jung, C., Schindler, D., Albrecht, A. T., and Buchholz, A.: The Role of Highly-Resolved Gust Speed in Simulations of Storm Damage in Forests at the Landscape Scale: A Case Study from Southwest Germany, Atmosphere, 7, 7, https://doi.org/10.3390/atmos7010007, 2016. a
Knigge, C. and Raasch, S.: Improvement and development of one- and two-dimensional discrete gust models using a large-eddy simulation model, J. Wind Eng. Ind. Aerodyn., 153, 46–59, 2016. a
Lilly, D. K. and Zipser, E. J.: The front range windstorm of 11 January 1972–A meteorological narrative, Weatherwise, 25, 56–63, 1972. a, b
Malavelle, F. F., Haywood, J. M., Field, P. R., Hill, A. A., Abel, S. J., Lock, A. P., Shipway, B. J., and McBeath, K.: A method to represent subgrid-scale updraft velocity in kilometer-scale models: Implication for aerosol activation, J. Geophys. Res.-Atmos., 119, 4149–4173, 2014. a
Martinez-Alvarado, O., Gray, S. L., Catto, J. L., and Clark, P. A.: Sting jets in intense winter North-Atlantic windstorms, Environ. Res. Lett., 7, 024014, https://doi.org/10.3402/tellusa.v66.22905, 2012. a, b, c
Martinez-Alvarado, O., Baker, L. H., Gray, S. L., Methven, J., and Plant, R. S.: Distinguishing the Cold Conveyor Belt and Sting Jet Airstreams in an Intense Extratropical Cyclone, Mon. Weather Rev., 142, 2571–2595, 2014. a, b, c, d
Mason, P. J. and Sykes, R. I.: Flow over an isolated hill of moderate slope, Q. J. Roy. Meteor. Soc., 105, 383–395, 1979. a
Mercer, A. and Dyer, J.: A New Scheme for Daily Peak Wind Gust Prediction Using Machine Learning, Procedia Comp. Sci., 36, 593–598, 2014. a, b
Mercer, A. E., Richman, M. B., and Bluestein, H. B.: Statistical Modeling of Downslope Windstorms in Boulder, Colorado, Weather Forecast., 23, 1176–1194, 2008. a, b
Mobbs, S. D., Vosper, S. B., Sheridan, P. F., Cardoso, R., Burton, R. R., Arnold, S. J., Hill, M. K., Horlacher, V., and Gadian, A. M.: Observations of downslope winds and rotors in the Falkland Islands, Q. J. Roy. Meteor. Soc., 131, 329–351, 2005. a
Mohandes, M. A., Halawani, T. O., Rehman, S., and Hussain, A. A.: Support vector machines for wind speed prediction, Renew. Energ., 29, 939–947, 2004. a
Nerini, D., Buzzi, M., and Trefalt, S.: Nowcasting of North Foehn wind gusts in Switzerland using AdaBoosting, in: World Weather Open Science Conference, 2014. a
Ngo, T. and Letchford, C.: A comparison of topographic effects on gust wind speed, J. Wind Eng. Ind. Aerodyn., 96, 2273–2293, 2008. a, b, c
Ngo, T. and Letchford, C.: Experimental study of topographic effects on gust wind speed, J. Wind Eng. Ind. Aerodyn., 97, 426–438, 2009. a, b, c, d
Palutikof, J. P., Brabson, B. B., Lister, D. H., and Adcock, S. T.: A review of methods to calculate extreme wind speeds, Meteorol. Appl., 6, 119–132, 1999. a
Panofsky, H. A. and Dutton, J. A.: Atmospheric Turbulence: Models and Methods for Engineering Applications, Wiley and Sons, New York, 1984. a
Panofsky, H. A., Tennekes, H., Lenschow, D. H., and Wyngaard, J. C.: The characteristics of turbulent velocity components in the surface layer under convective conditions, Bound.-Lay. Meteorol., 11, 355–361, 1977. a
Roberts, J. F., Champion, A. J., Dawkins, L. C., Hodges, K. I., Shaffrey, L. C., Stephenson, D. B., Stringer, M. A., Thornton, H. E., and Youngman, B. D.: The XWS open access catalogue of extreme European windstorms from 1979 to 2012, Nat. Hazards Earth Syst. Sci., 14, 2487–2501, https://doi.org/10.5194/nhess-14-2487-2014, 2014. a, b, c
Sallis, P. J., Claster, W., and Hernandez, S.: A machine learning algorithm for wind gust prediction, Comput. Geosci., 37, 1337–1344, 2011. a
Schicker, I., Papazek, P., Kanna, A., and Wang, Y.: Short-range wind speed predictions for complex terrain using an interval-artificial neural network, Energy Proced., 125, 199–206, 2017. a
Schubiger, F., Stauch, V., and Kaufmann, P.: Verification of different wind gust parametrizations, Overview of verification results at MeteoSwiss in the year 2012, in: COSMO General Meeting 2012, 2012. a, b
Scorer, R. S.: Theory of waves in the lee of mountains, Q. J. Roy. Meteor. Soc., 75, 41–56, 1949. a, b
Seregina, L. S., Haas, R., Born, K., and Pinto, J. G.: Development of a wind gust model to estimate gust speeds and their return periods, Tellus A, 66, 22905, https://doi.org/10.1088/1748-9326/7/2/024014, 2014. a, b
Shanmuganathan, S. and Sallis, P.: Data Mining Methods to Generate Severe Wind Gust Models, Atmosphere, 5, 60–80, 2014. a
Sheridan, P.: Review of Techniques and Research for Gust Forecasting and Parameterisation, Forecasting research technical report no. 570, Met Office, 2011. a, b, c, d
Sheridan, P., Vosper, S., and Brown, P.: Mountain Waves in High Resolution Forecast Models: Automated Diagnostics of Wave Severity and Impact on Surface Winds, Atmosphere, 8, https://doi.org/10.3390/atmos8010024, 2017. a, b
Sheridan, P. F. and Vosper, S. B.: Numerical simulations of rotors, hydraulic jumps and eddy shedding in the Falkland Islands, Atmos. Sci. Lett., 6, 211–218, 2006. a, b
Sheridan, P. F., Horlacher, V., Rooney, G. G., Hignett, P., Mobbs, S. D., and Vosper, S. B.: Influence of lee waves on the near-surface flow downwind of the Pennines, Q. J. Roy. Meteor. Soc., 133, 1353–1369, 2007. a
Shutts, G. J.: Operational lee wave forecasting, Meteorol. Appl., 4, 23–35, 1997. a, b
Spudic, V., Maric, M., and Peric, N.: Neural networks based prediction of wind gusts, in: European Wind Energy Conference, 2009. a
Sreelakshmi, K. and Kumar, P. R.: Short Term Wind Speed Prediction Using Support Vector Machine Model, WSEAS Transactions on Computer Science, 7, 1828–1837, 2008. a
Standen, J., Wilson, C., Vosper, S., and Clark, P.: Prediction of local wind climatology from Met Office models: Virtual Met Mast techniques, Wind Energy, 20, 411–430, 2017. a
Stucki, P., Dierer, S., Welker, C., Gomez-Navarro, J. J., Raible, C. C. ., Martius, O., and Brönnimann, S.: Evaluation of downscaled wind speeds and parameterised gusts for recent and historical windstorms in Switzerland, Tellus A, 68, 31820, https://doi.org/10.3402/tellusa.v68.31820, 2016. a, b
Suomi, I., Vihma, T., Gryning, S.-E., and Fortelius, C.: Wind-gust parametrizations at heights relevant for wind energy: a study based on mast observations, Q. J. Roy. Meteor. Soc., 139, 1298–1310, 2013. a, b
Suomi, I., Gryning, S.-E., Floors, R., Vihma, T., and Fortelius, C.: On the vertical structure of wind gusts, Q. J. Roy. Meteor. Soc., 141, 1658–1670, 2015. a
Suomi, I., Lüpkes, C., Hartmann, J., Vihma, T., Gryning, S.-E., and Fortelius, C.: Gust factor based on research aircraft measurements: a new methodology applied to the Arctic marine boundary layer, Q. J. Roy. Meteor. Soc., 142, 2985–3000, 2016. a
Suomi, I., Gryning, S.-E., O'Connor, E. J., and Vihma, T.: Methodology for obtaining wind gusts using Doppler lidar, Q. J. Roy. Meteor. Soc., 143, 2061–2072, 2017. a
Tedrake, R., Jackowski, Z., Cory, R., Roberts, J. W., and Hoburg, W.: Learning to Fly like a Bird, Tech. Rep., Massachusetts Institute of Technology, 2009. a
Thorarinsdottir, T. L. and Johnson, M. S.: Probabilistic Wind Gust Forecasting Using Nonhomogeneous Gaussian Regression, Mon. Weather Rev., 140, 889–897, 2012. a
Verkaik, J. W.: Evaluation of two gustiness models for exposure correction calculations, J. Appl. Meteorol., 39, 1613–1626, 2000. a
Volonte, A., Gray, S. L., and Clark, P. A.: The role of Mesoscale Instabilities in the Sting-Jet dynamics in Windstorm Tini, in: European Geosciences Union General Assembly 2017, 2017. a, b, c
Vosper, S. B.: Inversion effects on mountain lee waves, Q. J. Roy. Meteor. Soc., 130, 1723–1748, 2004. a
Vosper, S. B., Sheridan, P. F., and Brown, A. R.: Flow separation and rotor formation beneath two-dimensional trapped lee waves, Q. J. Roy. Meteor. Soc., 132, 2415–2438, 2006. a, b
Wang, J., Zhou, Q., Jiang, H., , and Hou, R.: Short-Term Wind Speed Forecasting Using Support Vector Regression Optimized by Cuckoo Optimization Algorithm, Math. Probl. Eng., 2015, 619178, https://doi.org/10.1155/2015/619178, 2015. a
Wang, J.-X., Wu, J.-L., and Xiao, H.: A Physics Informed Machine Learning Approach for Reconstructing Reynolds Stress Modeling Discrepancies Based on DNS Data, Phys. Rev. Fluids, 2, 034603, https://doi.org/10.1103/PhysRevFluids.2.034603, 2017a. a
Wang, J.-X., Wua, J., Ling, J., Iaccarino, G., and Xiao, H.: A Comprehensive Physics-Informed Machine Learning Framework for Predictive Turbulence Modeling, Elsevier, submitted, 2017b. a
Welker, C., Martius, O., Stucki, P., Bresch, D., Dierer, S., and Brönnimann, S.: Modelling economic losses of historic and present-day high-impact winter windstorms in Switzerland, Tellus A, 68, 29546, https://doi.org/10.3402/tellusa.v68.29546, 2016. a
Wieringa, J.: Roughness-dependent geographical interpolation of surface wind speed averages, Q. J. Roy. Meteor. Soc., 112, 867–889, 1986. a
Wilson, C., Webster, S., Vosper, S., Clark, P., Brown, A., Murkin, P., Leonard-Williams, A., Butcher, T., and Harrison, R.: The Met Office Virtual Met Mast, Tech. Rep., Met Office, 2010. a
World Meteorological Organization: Measurement of surface wind, in: Guide to Meteorological Instruments and Methods of Observation, WMO-No. 8, 7th edn, World Meteorological Organization, Geneva, Switzerland, 2008. a
Young, M. V. and Clark, M. R.: Development of localized damaging wind gusts associated with a frontal wave and mesoscale vortex across south Wales on 18 May 2015, Meteorol. Appl., 25, 139–150, 2018. a
Zeng, J. and Qiao, W.: Support Vector Machine-Based Short-Term Wind Power Forecasting, faculty publication 158, Tech. Rep., Department of Electrical and Computer Engineering, University of Nebraska-Lincoln, 2011. a