 | 11 Jul 2018
Description of a coastal impact event in Basque Country: the 9 February 2016 case
Santiago Gaztelumendi
Joseba Egaña
Pedro Liria
José A. Aranda
In this work we analysed a case from 9 February 2016 from two points of view, the meteorological–ocean characteristics of the event and the damage produced during the episode in the Basque coastal area. On 7 and 8 February 2016 an intense zonal circulation was established in the Atlantic, with very strong westerly winds (over 100 km h−1) and high fetch (more than 2000 km). As a consequence a strong swell (over 7 m) arrived on the Basque coast affecting littoral areas. The wave characteristics are particularly energetic during the morning of the 9 February, which had a significant wave of 9.5 m and a peak period of 20 s in deep water (Donostia buoy). The arrival of these energetic waves coincides with high tide during spring when the sea level reaches 4.69 m in the Port of Bilbao. Overtopping indexes exceeded red-level thresholds established within the Euskalmet coastal warning system and the wave impact resulted in relevant damage (more than EUR 3 million) in different littoral areas. This event is the first red-level case since the new Euskalmet warning procedure became operational at the beginning of 2015.


Basque Country is frequently (1–2 times per year) affected by swell episodes and high waves (over 7 m) as a consequence of high-fetch situations generated by remote deep lows and north-west gale configurations (Borja et al., 2004; Egaña et al., 2010, 2011, 2014a, b). These strong wave episodes are usually generated by deep depressions that move along the Atlantic in a south-west–north-east direction, following a marked zonal flow at high latitudes above the 50th parallel (Lackmann, 2015). When the waves generated by these deep depressions (down to 980 hPa) reach the Basque coast as swell at the same time as the spring tide (over 4.5 m), some impact in the coast is usually produced around high tide. On the Basque coast, sea storms in the nearest areas may have a significant wave height similar to that produced by most severe ones but occurring at a greater distance. However, the latter will generally present higher peak periods (over 20 s) which means higher energy and more destructive power when swell arrives at the coast (Gaztelumendi et al., 2014a)
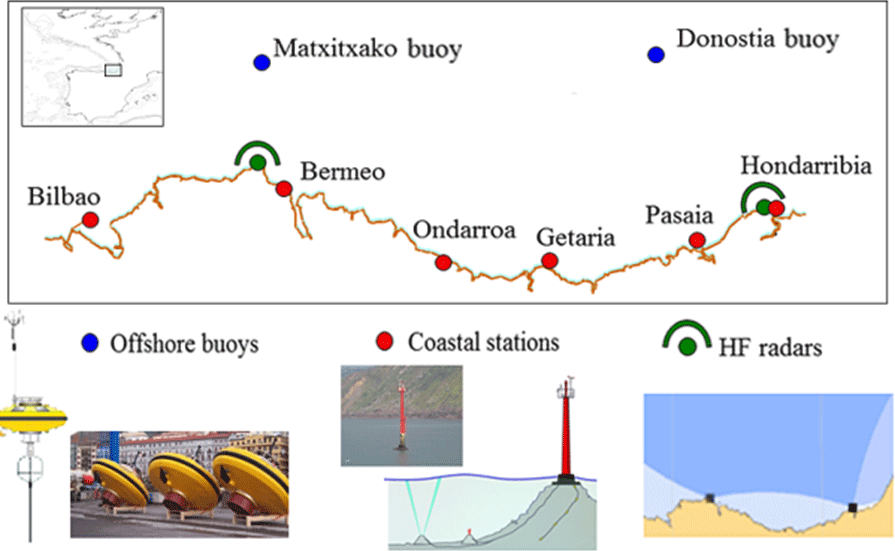

Figure 2Sea-level pressure (SLP) and wind (a, c, e) and waves and wind at 12:00 UTC (b, d, f) for 7, 8 and 9 February 2016 (top to down).
During the exceptional 2013–2014 winter (Egaña et al., 2014), numerous wave events impacted the Basque coast causing significant damage, particularly on 2 February 2014 (Egaña and Gaztelumendi, 2014). After analysis of those episodes and subsequent study of physical parameters correlated with the damage, a modification in the Basque marine–coastal warning system (Gaztelumendi et al., 2012) is done, including a new concept, the so-called “coastal impact” (Gaztelumendi et al., 2016a), mainly based in the “overtopping index”, a coastal-impact parameter that includes different ocean–meteorological variables (significant wave height, swell, peak period, tides, etc.) and marine-coastal characteristics (slope, orientation, etc.) (see Liria et al., 2014; Stockdon et al., 2006). We use operationally two overtopping indexes representing the flood level expected for the 2 % of the waves (I) and the maximum expected flood level (Imax). 0 level is the nautical reference (approximately the lowest spring water level). Wave action consists of calculating the wave run-up (RU) that is the maximum vertical extent of wave uprush on the coast above the still water level. For the calculation of the run-up, the empirical formulation of Stockdon (2006) is used and sea level includes the astronomical tide and the meteorological tide. At this moment the index is being estimated for a beach profile (low slope) facing north. This combination had the best fit with the integrated damage along the coast (Gaztelumendi et al., 2016a).
This new Euskalmet warning procedure (GV, 2015; Gaztelumendi et al., 2016a) became operational at the beginning of 2015. The studied event (9 February 2016) is the most relevant and the only red-level event that has happened since that time.
Data used for the characterization of meteorological–ocean conditions comes mainly from the Ocean–meteorological coastal Basque government network (see Fig. 1). We also included data from the operational Euskalmet wind-wave forecast system. The wind-wave forecast system used in Euskalmet is based on WaveWatch III. This is a third generation wind-wave model that solves the spectral action density balance equation for wave-number–direction spectra. In this implementation we use a first-order scheme for spatial propagation and a progressive nesting strategy. The wind fields are interpolated from Euskalmet operational numerical weather systems based on GFS and WRF models, depending on grid resolution, and introduced every 3 h (Ferrer et al., 2009; Gaztelumendi et al., 2010).

Figure 3Wave height (a), period (b) and direction (c) in Donostia buoy. Significant wave (red), maximum wave (dots), swell wave (green) and wind wave (blue), peak wave period (magenta).
In this work, Basque coastal-maritime conditions are characterized with some key parameters, as is the sea level (SL) at the Port of Bilbao and the significant wave height (Hs), peak period (Tp) and direction (D) at Pasaia buoy. Those parameters are used (in analysis and forecast mode) as the basis for the estimation of single overtopping indexes (I, Imax) representative of the entire Basque coast (Gaztelumendi et al., 2016a).
For the analysis of the impact we consider quantitative accepted claims data on “battering from coastal waters“ provided by the Spanish Insurance Compensation Consortium (CCS). The CCS information is structured by date, municipality, town, zip code, risk type and economic amount. A derived data file is prepared after manual depuration of raw data, with claims for the Basque littoral area due to wave impact. These data are analysed considering different aspects as location, damage type, amount, etc. in order to extract some conclusions.
Data analysis is performed by applying different techniques after segmentation of data in various categories considering type of affected property. Counting and statistics values are calculated by focusing on the number of accepted claims (#), paid amount (K€) and affected municipalities (M). R (R Core Team, 2014) and excel tools are used for data depuration, spatial analysis and reporting, including pivot tables and thematic maps.
Comparison with other episodes are performed at country level based on analysis of relevant physical-related parameters (Hs, Tp, D, SL, I, Imax) and impact-related ones (#, K€ and M).
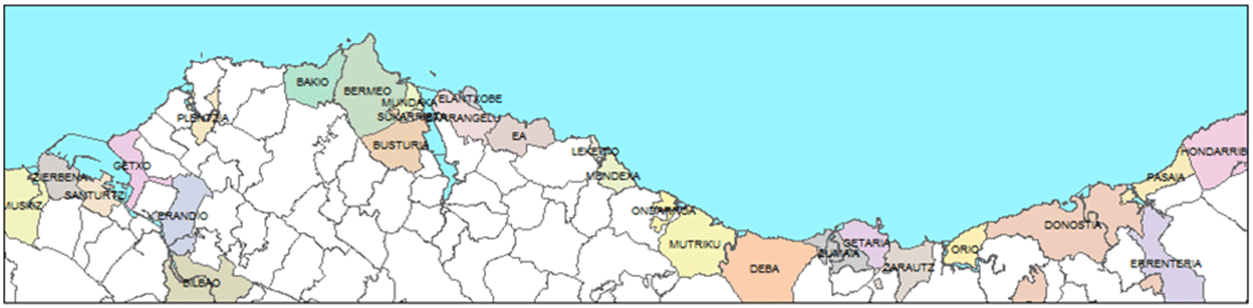


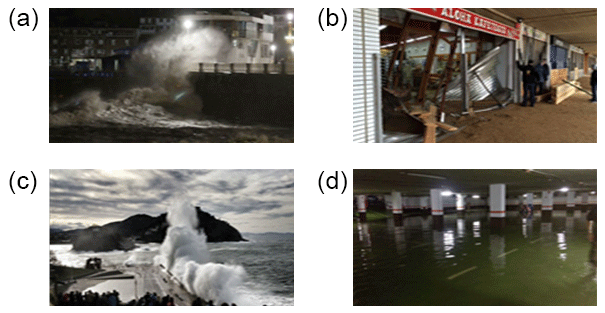
Figure 9Images of impact and damage from Zarauz and Donostia: waves battering the maritime club of de city of Donostia (a), damage on the Zarautz beach boardwalk (b), waves overtopping the promenade area of Paseo Nuevo in Donostia (c) and garage flooding in Donostia (d).
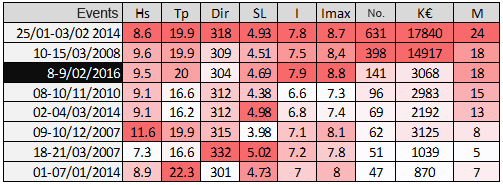
Figure 10Some ocean–meteorological (Hs, Tp, Dir, SL) and impact-related data (#, K€, M) for the 8 worst coastal events in Basque Country during the 21st century.
3.1 General environment
A deep depression in the Atlantic formed on 6 February, with a minimum pressure down to 960 mb. This low moves following the intense westerly flow from the south-west to north-east, moving to the north of the British Isles the next day as it is filled, although it continues to generate an intense westerly flow across the Bay of Biscay (see Fig. 2). The waves generated by this depression arrive as swell to the Basque coast on days 8 and 9 (see Fig. 2). Additionally wind-wave components are present due to the intense pressure gradient that forms between the high pressure of the Azores and low pressure located north of the British Isles.
3.2 Local environment
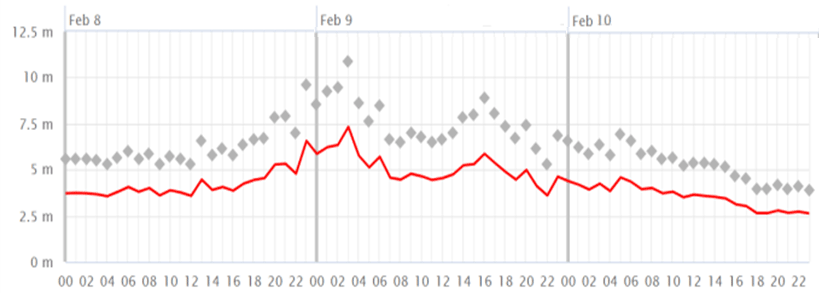
From day 7 the north-west swell increased in the Bay of Biscay, and during day 8 the significant wave height was around 5 m in the Donostia buoy (Fig. 1), reaching maximum values at night (significant wave height Hs = 9.5 m) and decreasing the following day (Fig. 3). At Pasaia coastal station (see Fig. 1 for location) the significant wave height exceeded 7 m (Fig. 4). The wave peak therefore arrived during the early morning of day 9 with a peak period of 20 s. In this way, the most energetic waves arrived during early morning, the north-west swell being the main component of the state of the sea. On days 9 and 10 the significant wave height decreased progressively.
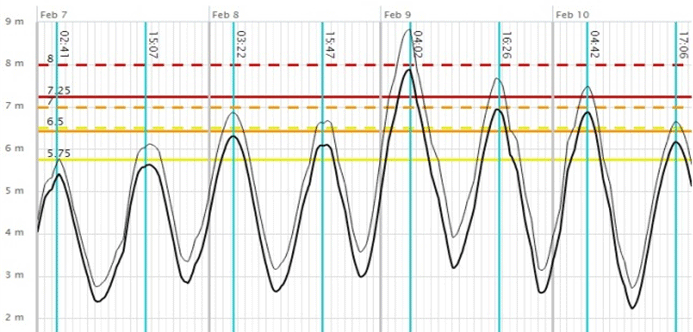
The arrival of the peak of the swell and therefore of the more energetic waves coincides with the first high tide of day 9 (05:00 LT), with a sea level that exceeds 4.5 m (4.69 m in the Port of Bilbao). It is known that these conditions can generate a high impact on the Basque coast (see Gaztelumendi et al., 2014a and b). The overtopping indexes surpass the established red-level thresholds during the first high tide of day 9 (GV, 2015). For the second high tide of day 9 and on the first of day 10 they also exceed the thresholds of the orange level (Fig. 5).
3.3 Impact
The impact along the Basque coast is relevant, particularly during the early morning of day 9. Significant damage occurs in Zarautz, especially to the bars and taverns of its seaside promenade. In Donostia various businesses next to the beach are affected and waves enter the old town, flooding garages and other properties. In Bermeo the breakwater of the harbour suffers significant damage. In Ondarroa the harbour is damaged and several vehicles are affected (see Figs. 6 and 9).
The claims paid by CCS exceed EUR 3 million, corresponding to 141 claims that affected to 19 municipalities. Bermeo, Donostia and Hondarribia concentrate more than 80 to 40 % of the number of accepted claims (#), Donostia produces 28 % of all claims, and Zarautz 14 %. The harbours of Bermeo and Hondarribia produced 80 % of the civil works claims. All industries accepted claims in Donostia and Getxo, and all business accepted claims in Donostia, Ondarroa and Zarautz. Regarding motor vehicles Ondarroa stands out with 60 % accepted claims. Accepted claims for housing are more distributed along the littoral area (see Figs. 6, 7 and 8).
In spite of the measures taken in advance (street closures, vehicle removal, deployment of flood barriers, etc.) due to the activation of the red alarm from 03:00 to 07:00, the wave impact generated a variety of material damage. The most affected areas were Donostia, Zarautz and Bermeo municipalities with 75 % damage, following similar spatial patterns of damage in other severe episodes affecting Basque Country (Gaztelumendi et al., 2016b and c). At the same time the orange level for navigation in the first two miles is activated (18:00 day 7 to 24:00 day 9), since a significant height wave (Hs) higher than 5 m was expected. Note that punctually in the port of Pasaia a value of Hs exceeding 7 m is registered (see Figs. 3 and 4).
Overtopping indexes (I, Imax) take maximum values around the first high tide on 9 February with values of I = 7.9 and Imax = 8.8. These values are the highest in the series since the new maritime–coastal warning system was made operational in early 2015.
If we analysed impact (using as a proxy # and K€) in the context of other events that occurred in previous years, this event would be in third place in terms of the number of accepted claims (#), fourth place in terms of material damage (K€) and second place in terms of affected municipalities (M) (see Fig. 10). Note that first place is for the 2 February 2014 episode, which had estimated economic losses of around EUR 18 million with 631 accepted claims affecting 24 municipalities and an overtopping index (I = 7.8 and Imax = 8.7) slightly lower than in the studied event (Fig. 10).
During the studied event the overtopping indexes are higher but K€ and # are far from being the first-ranked event. We can assume that activating the red-level days in advance may have significantly reduced the damage. This could be true, but we must also consider that, in spite of a high correlation, the relation between the value of aggregated damage for the Basque coast and simple overtopping indexes for the entire Basque coast is neither univocal nor lineal. In the case of 2 February 2014 the wave characteristics are relatively similar with Hs somewhat lower (8,6 m vs. 9,5 m) and Tp around 20 s. Therefore, the most important difference is the sea level value. In that event the maximum sea level registered in the Port of Bilbao was 4.94 m, in contrast with the case of 9 February 2016 with 4.69 m (Fig. 10). It is possible that the effect of sea level is more relevant and more significant than is already assumed in the actual procedure when calculating the overtopping indexes. To verify these issues it is necessary to have a longer series with a higher number of severe events and associated impact data.
In any case, the validation of all these issues implies a complex problem, since activating warnings and taking measures to mitigate the damage makes the relationship between damage and different physical parameters difficult to include properly in an operational early warning system.
This approximation for coastal impact is a first step in the objective to better understand, operationally evaluate and simply predict the specific risk associated with extreme wave flooding for the Basque coast. In any case particularized indexes could be desirable especially for some particular risk areas and cases. There are other pilot Coastal Early Warning Systems at the Iberian Peninsula coast. For instance, the project iCoast (Gracia et al., 2014) proposed a similar goal at the Catalan coast. iCoast could be an alternative and more complete methodology to the new Euskalmet warning procedure (GV, 2015) currently operational in Basque Country. The specific details and limits for the iCoast morphodynamic module can be found in Sánchez-Arcilla et al. (2014).
Basque Country is frequently affected by swell episodes and high waves as a consequence of high-fetch situations generated by remote deep lows and NW gale configurations (e.g. Egaña et al., 2010, 2011, 2014a and b). The coincidence of those situations with spring tides usually causes some degree of littoral impact and economic loss in the Basque littoral area. This wave event is framed in a typical situation of a deep low that passes far from our area, by the British Isles, generating waves that reach us as very energetic swell with a high period coincident with spring tides.
The study case presented in this work is the first red-level event since the new Basque coastal-maritime warning system became operational in 2015. The CCS pay for 141 claims as a consequence of damage during this episode for a total amount of more than EUR 3 million affecting 21 cities/villages (19 municipalities) along the Basque coast.
In order to extract the full conclusions about the impact due to battering from the waves using insurance claims data, many factors must be considered – not only physical (coastline configuration, orientation of sea walls and harbours, direct exposure to the incident wave field, configuration of beaches, etc.) and socioeconomic (distribution of human population and goods, characteristics and amount of the insured assets, etc.) ones but preventive measures applied or even chance.
Data sets used in this article are available by request from Basque Meteorology Agency (EUSKALMET).
The authors declare that they have no conflict of interest.
This article is part of the special issue “17th EMS Annual Meeting: European Conference for Applied Meteorology and Climatology 2017”. It is a result of the EMS Annual Meeting: European Conference for Applied Meteorology and Climatology 2017, Dublin, Ireland, 4–8 September 2017.
The authors would like to thank the Emergencies and Meteorology Directorate
(security department) of the Basque government for public provision of data and
operational service financial support and the Spanish Insurance Compensation
Consortium (CCS) for data provision. We also would like to thank all our
colleagues from EUSKALMET and TECNALIA for their daily effort in promoting
innovation and valuable services for the Basque community. Finally, we would
also like to thank the Free Software Movement and all institutions and
people that maintain and support availability of free data and tools.
Edited by: Manel Grifoll
Reviewed by: two anonymous referees
Egaña, J. and Gaztelumendi, S.: Destructive combination of strong waves and tides in the Basque Country: the 2 February 2014 case, 7th EuroGOOS Conference, Lisboa, 2014.
Egaña, J., Gaztelumendi, S., Gelpi, I., and Otxoa de Alda, K.: Analysis of oceano-meteorological conditions during Klaus episode on Basque Country area, 10EMS/8ECAC Conference, Zurich, 2010.
Egaña, J., Gaztelumendi, S., Ruiz, M., Pierna, D., Igelpi, I. R., and Otxoa De Alda, K.: Analysis of BECKY episode on Basque Country coastal area, 6th EuroGOOS Conference, Sopot, 2011.
Egaña, J., Gaztelumendi, S., and Hernánde, Z. R.: Analysis of 2014 winter patterns and its effects in Basque Country coastal area, 14th EMS / 10th ECAC, Prague, 2014.
Ferrer, L., González, M., Fontán, A., Mader, J., Uriarte, A., Gaztelumendi, S., Egaña, J., Gelpi, I. R., Otxoa de Alda, K., Morais, A., and Aranda, J. A,: Towards a future strategy in oceanography and meteorology for the Basque Country, GLOBEC International Newsletter, Vol. 15, No. 1, April 2009, 54–55, 2009.
Gaztelumendi, S., González, M., Egaña, J., Rubio, A., Gelpi, I. R., Fontán, A., Otxoa de Alda, K., Ferrer, L., and Alchaarani, N.: Implementation of an operational oceanometeorological system for the Basque Country, Thalassas, 26, 151–167, 2010.
Gaztelumendi, S., Egaña, J., Otxoa-de-Alda, K., Hernandez, R., Aranda, J., and Anitua, P.: An overview of a regional meteorology warning system, Adv. Sci. Res., 8, 157–166, https://doi.org/10.5194/asr-8-157-2012, 2012.
Gaztelumendi, S., Egaña, J., Gelpi, I. R., Carreño, S., Gonzalez, M., Liria, P., Rodriguez, G., Epelde, I., Rubio, A., and Aranda, J. A.: Characterization of coastal-maritime severe events in Basque Country, 7th EuroGOOS Conference, Lisboa, Portugal, 2014a.
Gaztelumendi, S., Egaña, J., Gelpi, I. R., Carreño, S., González, M., Liria, P., Esnaola, G., Rubio, A., and Aranda, J. A.: Analysis of coastal-maritime adverse events in Basque Country, 14th EMS & 10th ECAC, 2014b.
Gaztelumendi, S., Egaña, J., Liria, P., Gonzalez, M., Aranda, J. A., and Anitua, P.: The new Euskalmet coastal-maritime warning system, Adv. Sci. Res., 13, 91–96, https://doi.org/10.5194/asr-13-91-2016, 2016.
Gaztelumendi, S., Egaña, J., Liria, P., Epelde, I., González, M., Aranda, J. A., and Anitua, P.: Damages analysis in Basque coastal area, V International Symposium on Oceanography of the Bay of Biscay, Bilbao, 2016b.
Gaztelumendi, S., Egaña, J., Liria, P., González, M., and Aranda, J. A.: Analysis of coastal impact in Basque Country, 16th EMS/11th ECAC, 2016c.
González, M., Uriarte, A., Fontán, A., Mader, J., and Gyssels, P.: Marine Dynamics, Chap. 6 on Oceanography and marine environment of the Basque Country, edited by: Borja, A. and Collins, M., Elsevier Oceanography Series, 2004.
Gracia, V., García-León, M., Sánchez-Arcilla, A., Gault, J., Oller, P., Fernández, J., Sairouní, A., Cristofori, E., and Toldrà, R.: A new generation of early warning systems for coastal risk: the iCoast project : International Conference on Coastal Engineering, Proceedings of 34th International Conference on Coastal Engineering, Seoul, 1–8, 2014.
GV: Plan de predicción y vigilancia de fenómenos meteorológicos adversos, internal documentation from Basque Government, Vitoria-Gasteiz, 2015.
Lackmann, G.: Midlatitude Synoptic Meteorology, Dynamics, analysis and forecasting, AMS books, Boston, 2015.
Liria, P., Epelde, I., Gaztelumendi, S., Egaña, J., Gelpi, I. R., Carreño, S., Gonzalez, M., and Aranda, J.: Los temporales de enero, febrero y marzo de 2014 dentro del contexto del clima marino de la costa vasca, Efectos sobre las infraestructuras costeras y las playas, XVI Congreso y Exposición ECOPLAYAS, Bilbao, 2014.
R Core Team: R: A language and environment for statistical computing, R Foundation for Statistical Computing, Vienna, Austria, available at: http://www.R-project.org/ (last access: 3 July 2017), 2014.
Sánchez-Arcilla, A., García-León, M., and Gracia, V.: Hydro-morphodynamic modelling in Mediterranean storms – errors and uncertainties under sharp gradients, Nat. Hazards Earth Syst. Sci., 14, 2993–3004, https://doi.org/10.5194/nhess-14-2993-2014, 2014.
Stockdon, H. F., Holman, R. A., Howd, P. A., and Sallenger, A. H.: Empirical parametrization of setup, swash and runup, Coast. Eng., 53, 573–588, 2006.